

Multiplexed droplet single-cell RNA-sequencing using natural genetic variation
- PMID: 29227470
- PMCID: PMC5784859
- DOI: 10.1038/nbt.4042
Multiplexed droplet single-cell RNA-sequencing using natural genetic variation
Erratum in
-
Author Correction: Multiplexed droplet single-cell RNA-sequencing using natural genetic variation.Nat Biotechnol. 2020 Nov;38(11):1356. doi: 10.1038/s41587-020-0715-9. Nat Biotechnol. 2020. PMID: 33057163
Abstract
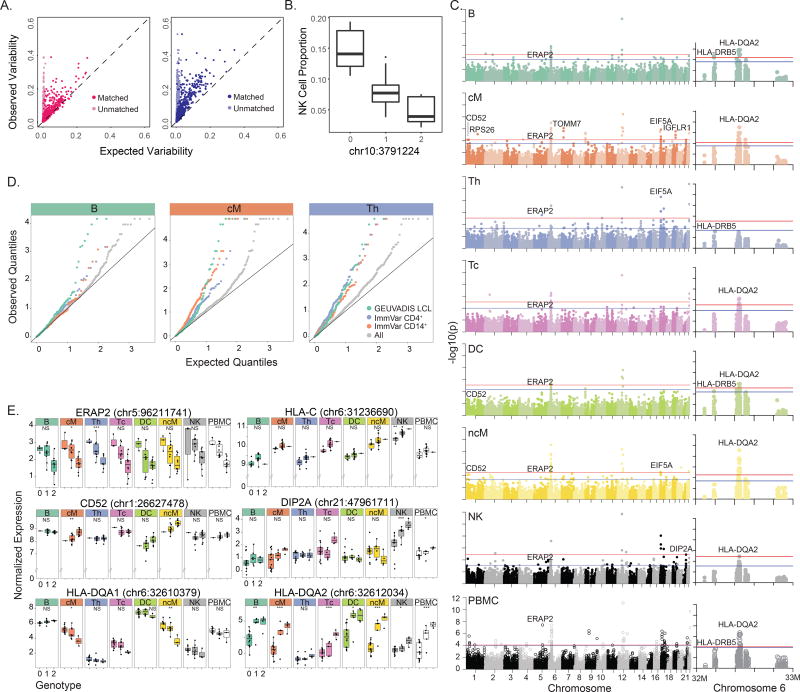
Droplet single-cell RNA-sequencing (dscRNA-seq) has enabled rapid, massively parallel profiling of transcriptomes. However, assessing differential expression across multiple individuals has been hampered by inefficient sample processing and technical batch effects. Here we describe a computational tool, demuxlet, that harnesses natural genetic variation to determine the sample identity of each droplet containing a single cell (singlet) and detect droplets containing two cells (doublets). These capabilities enable multiplexed dscRNA-seq experiments in which cells from unrelated individuals are pooled and captured at higher throughput than in standard workflows. Using simulated data, we show that 50 single-nucleotide polymorphisms (SNPs) per cell are sufficient to assign 97% of singlets and identify 92% of doublets in pools of up to 64 individuals. Given genotyping data for each of eight pooled samples, demuxlet correctly recovers the sample identity of >99% of singlets and identifies doublets at rates consistent with previous estimates. We apply demuxlet to assess cell-type-specific changes in gene expression in 8 pooled lupus patient samples treated with interferon (IFN)-β and perform eQTL analysis on 23 pooled samples.
Figures


Similar articles
-
dropEst: pipeline for accurate estimation of molecular counts in droplet-based single-cell RNA-seq experiments.Genome Biol. 2018 Jun 19;19(1):78. doi: 10.1186/s13059-018-1449-6. Genome Biol. 2018. PMID: 29921301 Free PMC article.
-
Ultra-high-throughput single-cell RNA sequencing and perturbation screening with combinatorial fluidic indexing.Nat Methods. 2021 Jun;18(6):635-642. doi: 10.1038/s41592-021-01153-z. Epub 2021 May 31. Nat Methods. 2021. PMID: 34059827 Free PMC article.
-
SCITO-seq: single-cell combinatorial indexed cytometry sequencing.Nat Methods. 2021 Aug;18(8):903-911. doi: 10.1038/s41592-021-01222-3. Epub 2021 Aug 5. Nat Methods. 2021. PMID: 34354295 Free PMC article.
-
High Throughput Single Cell RNA Sequencing, Bioinformatics Analysis and Applications.Adv Exp Med Biol. 2018;1068:33-43. doi: 10.1007/978-981-13-0502-3_4. Adv Exp Med Biol. 2018. PMID: 29943294 Review.
-
The promise of single-cell RNA sequencing for kidney disease investigation.Kidney Int. 2017 Dec;92(6):1334-1342. doi: 10.1016/j.kint.2017.06.033. Epub 2017 Oct 12. Kidney Int. 2017. PMID: 28893418 Free PMC article. Review.
Cited by
-
Scalable, multimodal profiling of chromatin accessibility, gene expression and protein levels in single cells.Nat Biotechnol. 2021 Oct;39(10):1246-1258. doi: 10.1038/s41587-021-00927-2. Epub 2021 Jun 3. Nat Biotechnol. 2021. PMID: 34083792 Free PMC article.
-
HLA and KIR genetic association and NK cells in anti-NMDAR encephalitis.Front Immunol. 2024 Jul 10;15:1423149. doi: 10.3389/fimmu.2024.1423149. eCollection 2024. Front Immunol. 2024. PMID: 39050850 Free PMC article.
-
Autism spectrum disorder at the crossroad between genes and environment: contributions, convergences, and interactions in ASD developmental pathophysiology.Mol Autism. 2020 Sep 10;11(1):69. doi: 10.1186/s13229-020-00370-1. Mol Autism. 2020. PMID: 32912338 Free PMC article. Review.
-
Inference of B cell clonal families using heavy/light chain pairing information.PLoS Comput Biol. 2022 Nov 28;18(11):e1010723. doi: 10.1371/journal.pcbi.1010723. eCollection 2022 Nov. PLoS Comput Biol. 2022. PMID: 36441808 Free PMC article.
-
Single-cell omics: experimental workflow, data analyses and applications.Sci China Life Sci. 2025 Jan;68(1):5-102. doi: 10.1007/s11427-023-2561-0. Epub 2024 Jul 23. Sci China Life Sci. 2025. PMID: 39060615 Review.
References
-
- Patel AP, et al. Science. Vol. 344. American Association for the Advancement of Science; 2014. pp. 1396–1401. - PubMed
Publication types
MeSH terms
Substances
Grants and funding
- R38 AI140299/AI/NIAID NIH HHS/United States
- U19 AI090023/AI/NIAID NIH HHS/United States
- T32 GM067547/GM/NIGMS NIH HHS/United States
- T32 GM007618/GM/NIGMS NIH HHS/United States
- R03 DE025665/DE/NIDCR NIH HHS/United States
- R21 AI133337/AI/NIAID NIH HHS/United States
- P30 AR070155/AR/NIAMS NIH HHS/United States
- R01 AR071522/AR/NIAMS NIH HHS/United States
- U01 HL137182/HL/NHLBI NIH HHS/United States
- U01 DP005120/DP/NCCDPHP CDC HHS/United States
- K25 HL121295/HL/NHLBI NIH HHS/United States
- U01 DP006486/DP/NCCDPHP CDC HHS/United States
- F30 DK115167/DK/NIDDK NIH HHS/United States
LinkOut - more resources
Full Text Sources
Other Literature Sources
Medical
Molecular Biology Databases
