

The TRPV1 ion channel regulates thymocyte differentiation by modulating autophagy and proteasome activity
- PMID: 29207602
- PMCID: PMC5710883
- DOI: 10.18632/oncotarget.21798
The TRPV1 ion channel regulates thymocyte differentiation by modulating autophagy and proteasome activity
Abstract
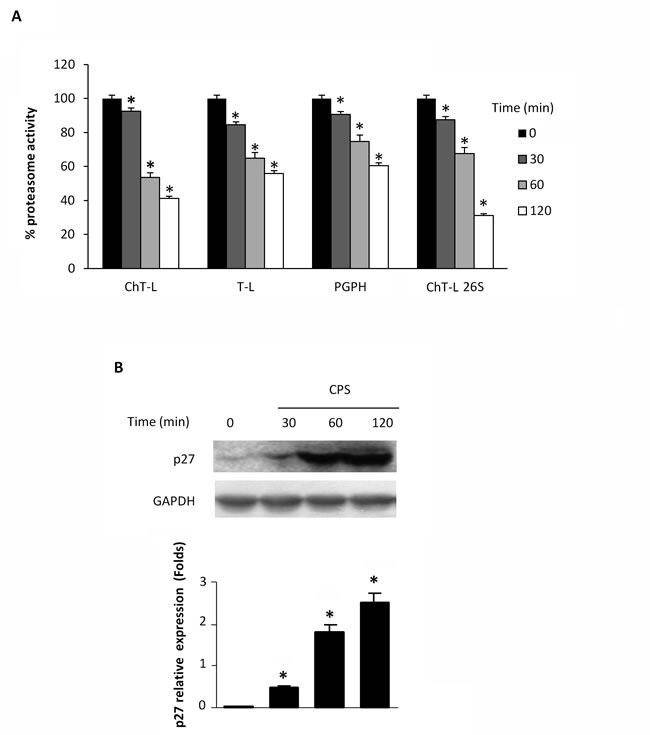
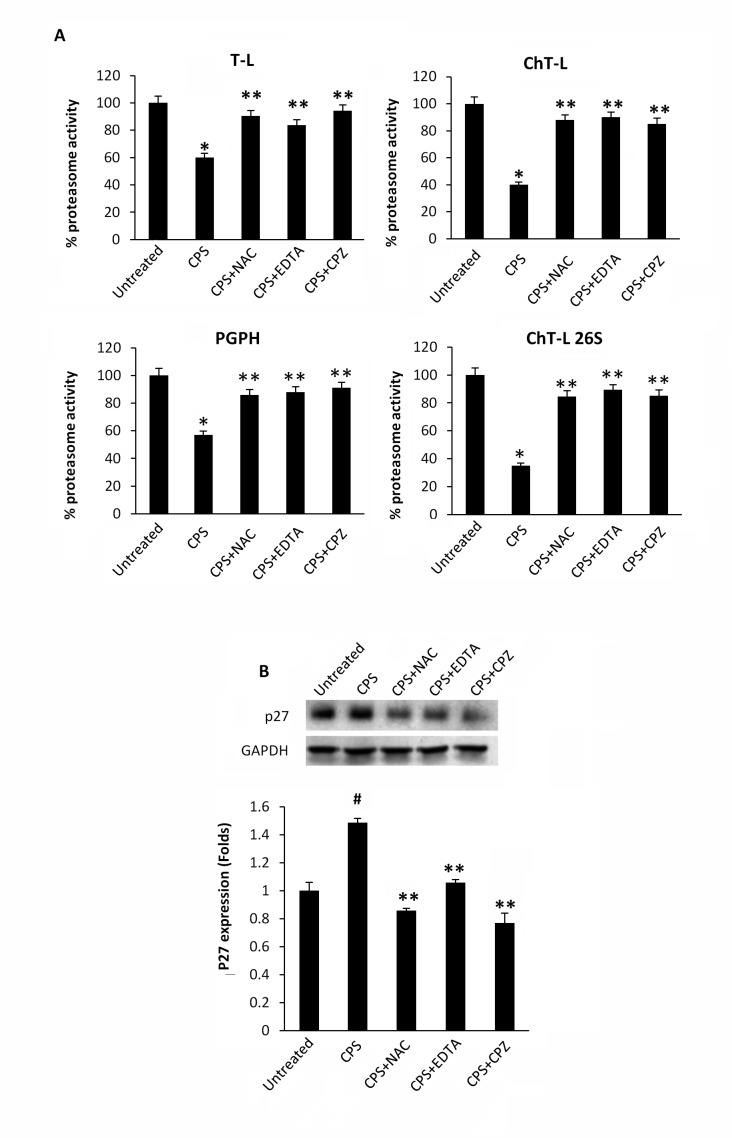
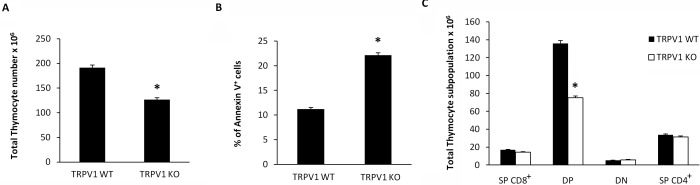
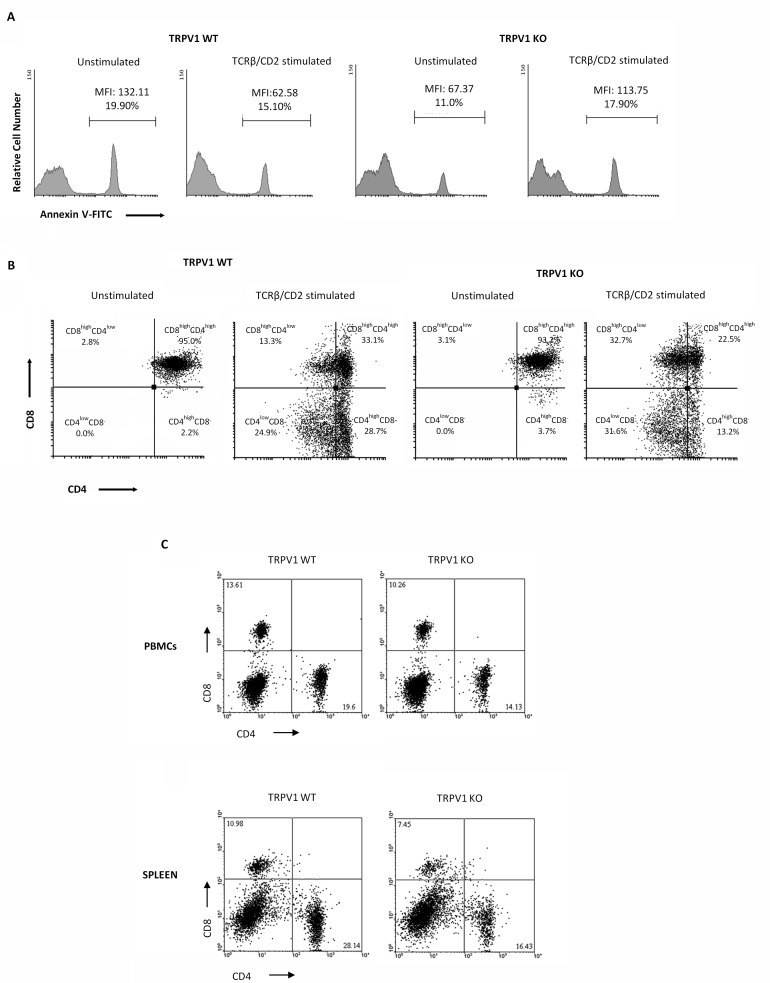
Autophagy and the ubiquitin-proteasome system (UPS) control thymus cell homeostasis under resting and endoplasmic reticulum (ER) stress conditions. Several evidence support a cross-talk between UPS and autophagy; abrogation of UPS responses stimulates autophagy, and vice versa the inhibition of autophagy alters the UPS functions. Herein, we found that TRPV1 activation induces ER stress, proteasome dysfunction and autophagy in thymocytes by modulating the expression of UPR-related genes. The TRPV1-mediated autophagy prevents the UPR activation by inhibiting BiP, Grp94 and ERp57 chaperone protein expression. Thymocytes from TRPV1 KO mice display both autophagy and proteasome dysfunctions, resulting in increased apoptotic cells and reduced total DP thymocyte number. In addition, positive selection of thymocytes triggered by anti-TCRβ/CD2 Ab-mediated costimulation induces apoptosis in thymocytes from TRPV1 KO as compared with WT mice. Stimulation of TRPV1 KO thymocytes with anti-TCRβ/CD2 mAbs modulates the expression of CD4 antigen on purified DP thymocytes, with reduced number of mature, single positive (SP) CD4 and increased number of immature SP CD4low and DP CD4lowCD8+ thymocytes, further supporting the intrinsic role of TRPV1 in T cell maturation. Finally, a reduction in CD8+ and CD4+ T cells is evidenced in the peripheral blood and spleen of TRPV1 KO, as compared with WT mice. Therapeutic strategy by restraining or stimulating the TRPV1 expression and functions in thymocytes might represent a new pharmacological tool in the regulation of different inflammatory T cell responses.
Keywords: ER stress; Immune response; Immunity; Immunology and Microbiology Section; TRPV1; TRPV1 KO mice; autophagy; capsaicin.
Conflict of interest statement
CONFLICTS OF INTEREST The authors declare no conflicts of interest.
Figures


Similar articles
-
Transient receptor potential vanilloid 1 activation induces autophagy in thymocytes through ROS-regulated AMPK and Atg4C pathways.J Leukoc Biol. 2012 Sep;92(3):421-31. doi: 10.1189/jlb.0312123. Epub 2012 Jun 29. J Leukoc Biol. 2012. PMID: 22753949
-
Effects of purine nucleoside phosphorylase deficiency on thymocyte development.J Allergy Clin Immunol. 2011 Oct;128(4):854-863.e1. doi: 10.1016/j.jaci.2011.07.039. Epub 2011 Aug 25. J Allergy Clin Immunol. 2011. PMID: 21868080
-
Antigen-specific and nonspecific deletion of immature cortical thymocytes caused by antigen injection.Eur J Immunol. 1997 Oct;27(10):2726-36. doi: 10.1002/eji.1830271037. Eur J Immunol. 1997. PMID: 9368633
-
Reduced generation but efficient TCR beta-chain selection of CD4+8+ double-positive thymocytes in mice with compromised CD3 complex signaling.J Immunol. 1999 Mar 1;162(5):2741-7. J Immunol. 1999. PMID: 10072519
-
Cross-talk between the T cell antigen receptor and the glucocorticoid receptor regulates thymocyte development.Stem Cells. 1996 Sep;14(5):490-500. doi: 10.1002/stem.140490. Stem Cells. 1996. PMID: 8888490 Review.
Cited by
-
Multifunctional TRPV1 Ion Channels in Physiology and Pathology with Focus on the Brain, Vasculature, and Some Visceral Systems.Biomed Res Int. 2019 May 27;2019:5806321. doi: 10.1155/2019/5806321. eCollection 2019. Biomed Res Int. 2019. PMID: 31263706 Free PMC article. Review.
-
Physiological Overview of the Potential Link between the UPS and Ca2+ Signaling.Antioxidants (Basel). 2022 May 19;11(5):997. doi: 10.3390/antiox11050997. Antioxidants (Basel). 2022. PMID: 35624861 Free PMC article. Review.
-
Lipopolysaccharide pretreatment increases the sensitivity of the TRPV1 channel and promotes an anti-inflammatory phenotype of capsaicin-activated macrophages.J Inflamm (Lond). 2024 May 24;21(1):17. doi: 10.1186/s12950-024-00391-0. J Inflamm (Lond). 2024. PMID: 38790047 Free PMC article.
-
"Immuno-Transient Receptor Potential Ion Channels": The Role in Monocyte- and Macrophage-Mediated Inflammatory Responses.Front Immunol. 2018 Jun 6;9:1273. doi: 10.3389/fimmu.2018.01273. eCollection 2018. Front Immunol. 2018. PMID: 29928281 Free PMC article. Review.
-
The effects of cannabidiol via TRPV2 channel in chronic myeloid leukemia cells and its combination with imatinib.Cancer Sci. 2022 Apr;113(4):1235-1249. doi: 10.1111/cas.15257. Epub 2022 Mar 4. Cancer Sci. 2022. PMID: 34971020 Free PMC article.
References
-
- Michalak M, Robert Parker JM, Opas M. Ca2+ signaling and calcium binding chaperones of the endoplasmic reticulum. Cell Calcium. 2002;32:269–278. - PubMed
-
- Hershko A, Ciechanover A. The ubiquitin system. Annu Rev Biochem. 1998;67:425–479. - PubMed
-
- Moretti L, Cha YI, Niermann KJ, Lu B. Switch between apoptosis and autophagy: radiation-induced endoplasmic reticulum stress? Cell Cycle. 2007;6:793–798. - PubMed
LinkOut - more resources
Full Text Sources
Other Literature Sources
Research Materials
Miscellaneous
