. 2017 Dec 5;8(1):1931.
doi: 10.1038/s41467-017-02035-9.

Pandemic H1N1 influenza A viruses suppress immunogenic RIPK3-driven dendritic cell death

Affiliations

Pandemic H1N1 influenza A viruses suppress immunogenic RIPK3-driven dendritic cell death

Boris M Hartmann et al. Nat Commun. .

Abstract

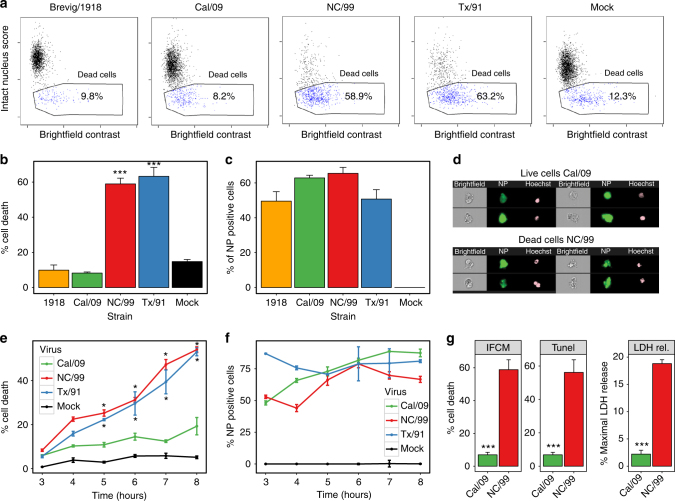
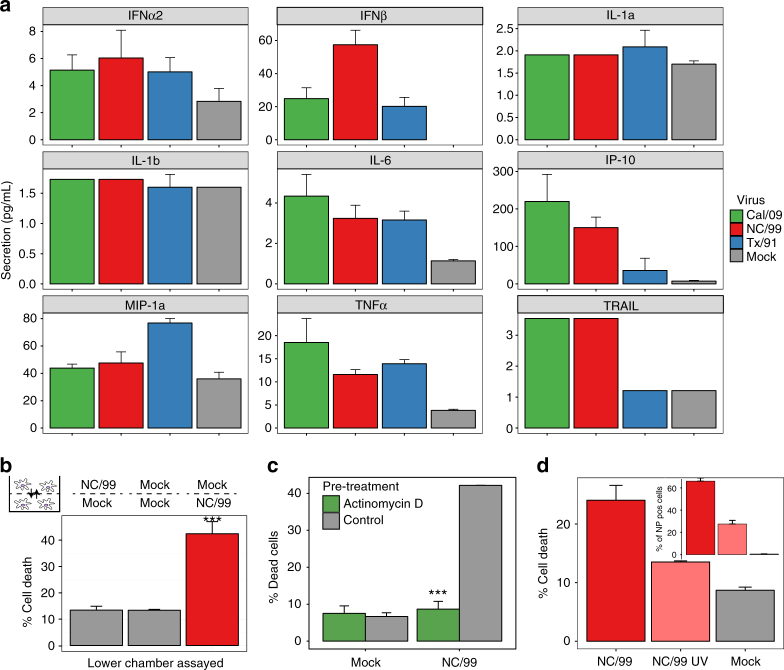
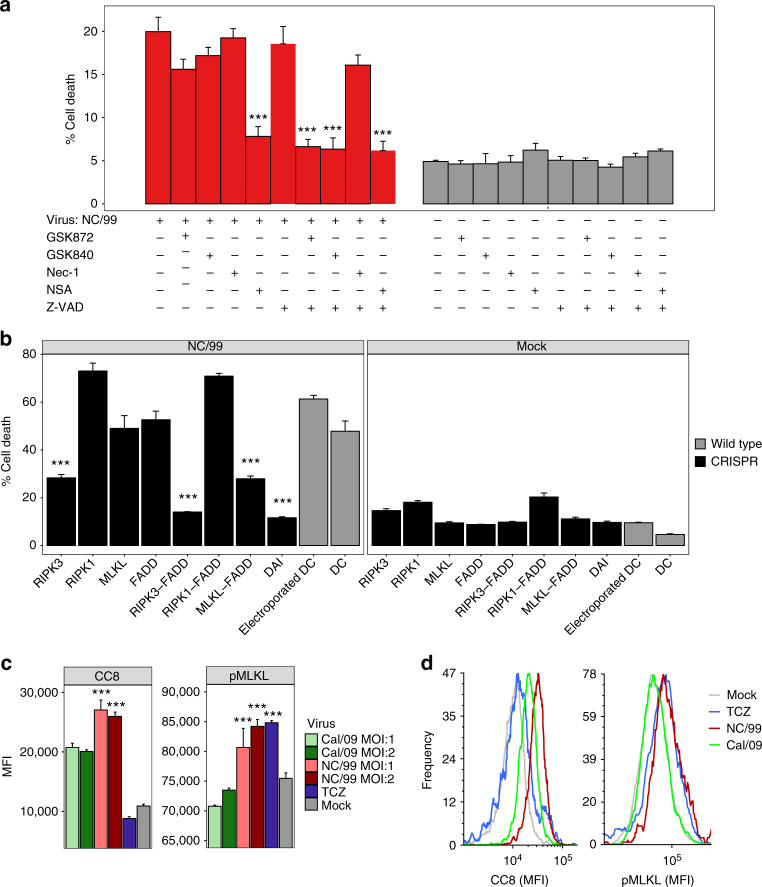
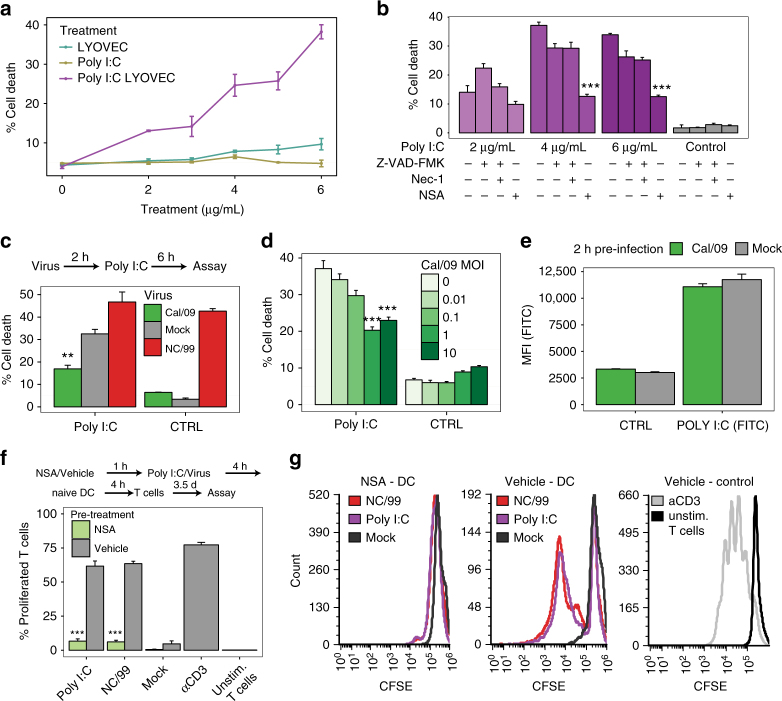
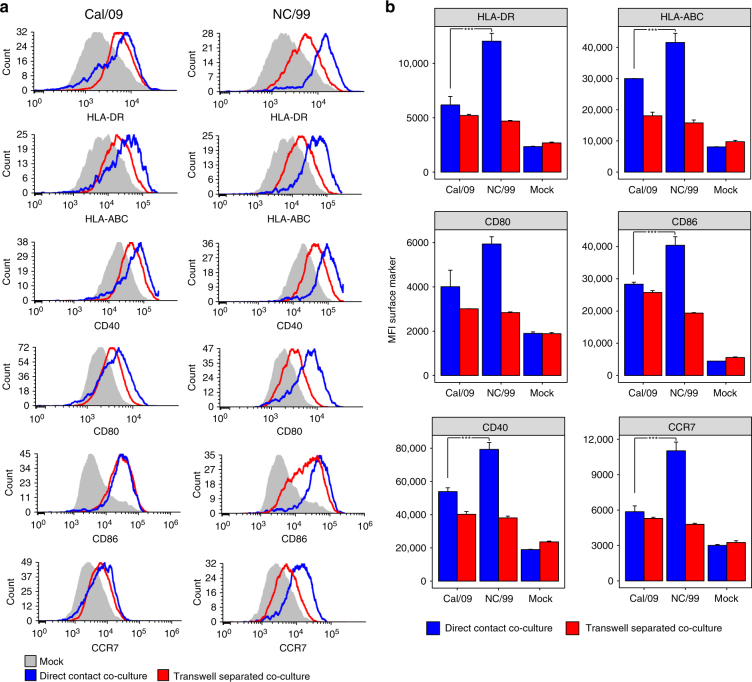
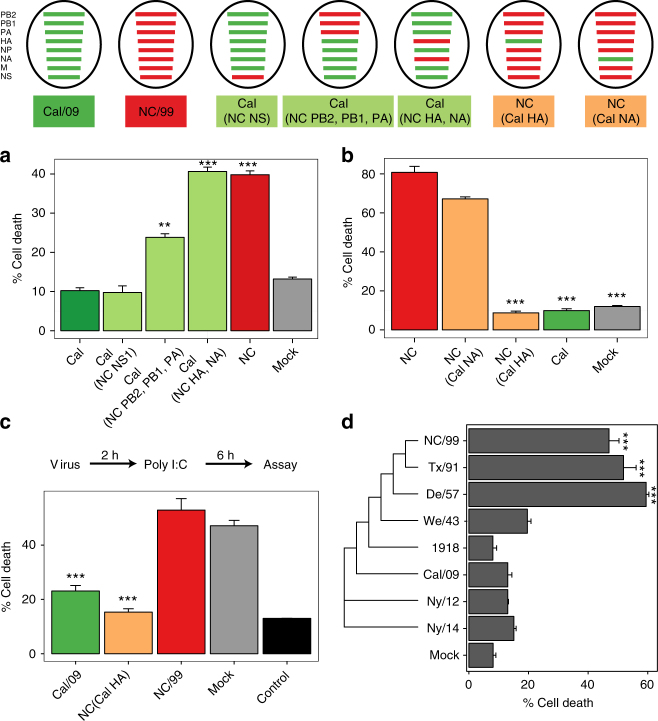
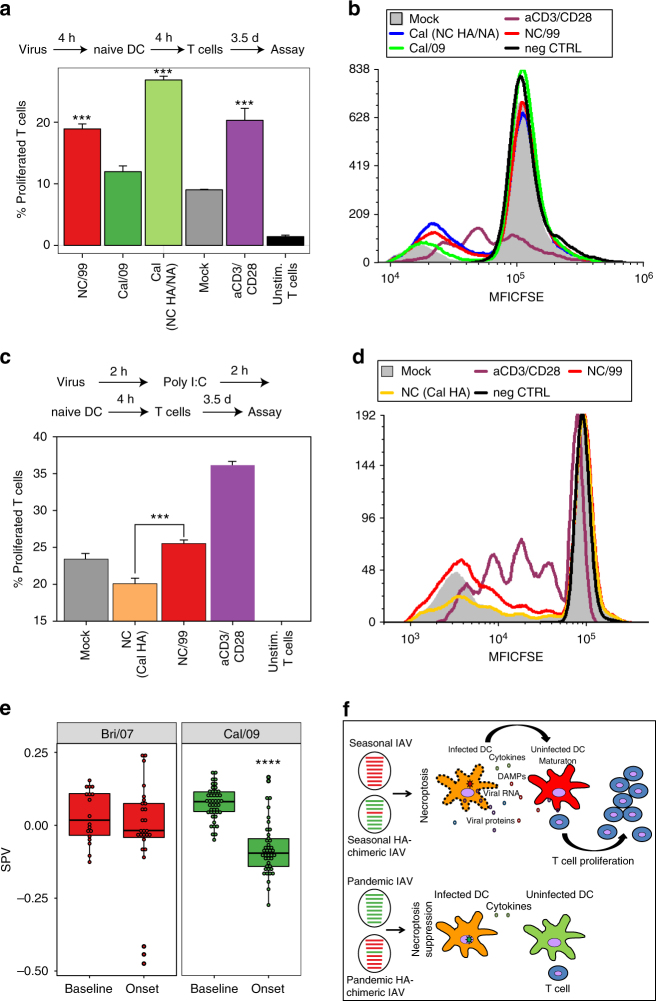
The risk of emerging pandemic influenza A viruses (IAVs) that approach the devastating 1918 strain motivates finding strain-specific host-pathogen mechanisms. During infection, dendritic cells (DC) mature into antigen-presenting cells that activate T cells, linking innate to adaptive immunity. DC infection with seasonal IAVs, but not with the 1918 and 2009 pandemic strains, induces global RNA degradation. Here, we show that DC infection with seasonal IAV causes immunogenic RIPK3-mediated cell death. Pandemic IAV suppresses this immunogenic DC cell death. Only DC infected with seasonal IAV, but not with pandemic IAV, enhance maturation of uninfected DC and T cell proliferation. In vivo, circulating T cell levels are reduced after pandemic, but not seasonal, IAV infection. Using recombinant viruses, we identify the HA genomic segment as the mediator of cell death inhibition. These results show how pandemic influenza viruses subvert the immune response.


Conflict of interest statement

The authors declare no competing financial interests.

Figures

Fig. 1
Fig. 1
Seasonal but not pandemic IAVs induce human DC death. DC were infected for 8 h with either mock or the indicated IAV strains. Cell death was assayed through quantification of nuclear fragmentation and assessment of cell morphology by imaging flow cytometry. The Brevig/1918 and Cal/09 are pandemic IAV strains, whereas the NC/99 and Tx/91 are seasonal IAV strains. a Flow cytometry plots illustrating the percentage of dead cells after DC infection. Percentage of cell death (b) and of NP-positive cells (c) following infection. ***p < 0.001. d Sample images of live cells following Cal/09 infection, and dead cells following NC/99 infection. Data are representative of three independent experiments using DC derived from different donors. n = 3 for experimental groups and for mock-infected controls. Time-course measurements of the percentages of cell death (e) and of the proportion of NP-expressing cells following DC infection (for 3–8 h) (f). *p < 0.005. Data are representative of four independent experiments using DC derived from different donors. n = 3 for experimental groups and for mock-infected controls. g Comparison of the percentage of cell death measurements obtained by imaging flow cytometry (IFCM), TUNEL method, and lactate dehydrogenase release cytotoxicity assay (LDH rel.). Note that the percentage of cell death in untreated cells and in infected cells varies in DC obtained from different individual donors. Data shown in ag were obtained in DC from three different donors, respectively. ***p < 0.005. This experiment was performed three times. n = 3 technical replicates. b, c, eg Values shown are median ± s.e.m, ANOVA followed by Tukey’s honest significant difference (HSD) test
Fig. 2
Fig. 2
Cell death induced by seasonal NC/99 IAV depends on viral RNA replication. a Cytokine and chemokine release 4 h after DC infection with either mock, seasonal (NC/99; Tx/91), or pandemic (Cal/09) strains. Supernatants were collected, and cytokine and chemokine levels were measured by multiplex ELISA. The levels of IL-1a, IL-1b, TRAIL, and IL-6 are near or below the limits of detection for this assay. b Transwell experiment (see inset diagram) where mock-infected DC (lower chamber) were exposed to paracrine signaling from NC/99- or mock-infected DC (upper chamber). NC/99-infected cells in the lower chamber were used as a positive control. c Effect of a 30-min pretreatment with actinomycin D (2 μM) on virus-induced cell death. d Effect of reduced infectivity via UV irradiation (NC/99 UV) on virus-induced cell death. The inset shows the percentage of NP-positive cells under the different conditions. b, c, d DC were infected for 8 h with either mock or NC/99 IAV. Percentage of cell death was determined by imaging flow cytometry. Data are representative of two a, d or three b, c independent experiments using DC derived from different donors. n = 3 for experimental groups and for mock-infected controls. ***p < 0.001, ANOVA followed by Tukey’s HSD test. Values shown are median ± s.e.m
Fig. 3
Fig. 3
Seasonal NC/99 IAV induces RIPK3-dependent apoptosis and necroptosis. a DC infected for 8 h with either mock or NC/99 IAV were pretreated for 1 h with various pharmacological inhibitors: Z-VAD-FMK (20 μM), necrosulfonamide (NSA; 15 μM), GSK872 (5 μM), GSK840 (5 μM), and necrostatin (Nec-1; 30 μM). Percentage of cell death was determined by imaging flow cytometry. b Genetic ablation of RIPK1, RIPK3, MLKL, FADD, and DAI, either alone or in combination, was carried out by electroporation of DC with CRISPR/Cas9 ribonucleoproteins. Electroporated DC (negative control), DC electroporated with Cas9 Nuclease in the absence of targeting guide RNAs. Following an 8-h infection with either mock or NC/99 IAV, cell death was assayed in DC selected for having low levels of expression of the ablated gene(s) by imaging flow cytometry analysis (Supplementary Fig. 3). c, d Imaging flow cytometry measurements of MLKL phosphorylation and caspase 8 cleavage following a 5-h infection with either mock, NC/99, or Cal/09 IAV at the indicated multiplicities of infection (MOIs). DC treated for 5 h with the combination of TNFα (0.1 μg/ml), cycloheximide (2 μg/ml), and Z-VAD-FMK (50 μM; TCZ), a necroptosis inducer, were used as positive control. MFI, mean fluorescence intensity. c is a summary plot; d shows representative imaging flow cytometry plots. a Data are representative of two independent experiments with all inhibitors using DC derived from different donors. Additional experiments employing combinations of Z-VAD-FMK and one or two of the other inhibitors were repeated 3–8 times using cells from different donors. n = 3 for experimental groups and for mock-infected controls. b, c Data are representative of two independent experiments using cells from different donors. n = 3 for experimental groups and for controls. ***p < 0.001, ANOVA followed by Tukey’s HSD test, with an additional Bonferroni multiple-testing correction for summarized data. Values shown are median ± s.e.m
Fig. 4
Fig. 4
Pandemic Cal/09 IAV impairs poly I:C-induced cell death. a DC were treated for 8 h with increasing concentrations of either poly I:C, poly I:C combined with the transfecting agent LYOVEC, or LYOVEC alone. b DC were pretreated with the indicated pharmacological inhibitors for 1 h, and then transfected for 6 h with various concentrations of poly I:C (with LYOVEC) or with control. c DC were infected for 2 h with either mock, NC/99, or Cal/09 IAV, and then transfected with either poly I:C (4 μg/ml) or control for 6 h. d DC were infected for 2 h with Cal/09 at increasing MOIs, and then transfected with either poly I:C (4 μg/ml) or control for 6 h. ad Percentage of cell death was determined by imaging flow cytometry. e DC were infected with either mock or Cal/09 for 2 h, and then transfected with either GFP-labeled poly I:C (4 μg/ml) or vehicle for 2 h. Transfection efficiency was determined by imaging flow cytometry via measurement of GFP expression. FITC, fluorescein isothiocyanate. f, g DC were pretreated for 1 h with either 15 μM NSA or vehicle, and either transfected with poly I:C (4 μg/ml) or infected with NC/99 or mock for 4 h. DC were then washed, cocultured with naive autologous DC for 4 h, and cocultured with carboxyfluorescein succinimidyl ester (CFSE)-labeled allogeneic T cells for 3.5 days. The percentage of proliferated T cells was determined by imaging flow cytometry as a decrease in cell fluorescence. T cells incubated with anti-CD3/CD28-coated beads served as a positive control. f is a summary plot; g shows representative imaging flow cytometry plots. Data shown in different panels were obtained using cells from different donors. Note that the absolute percentage of cell death induced by poly I:C transfection or virus infection can vary across experiments. Data are representative of three a, b, df or five c independent experiments using cells from different donors. n = 3 for experimental groups and for controls. a, b, df ***p < 0.001; c **p < 0.005, ANOVA followed by Tukey’s HSD test, with an additional Bonferroni multiple-testing correction for summarized data. Values shown are median ± s.e.m
Fig. 5
Fig. 5
Analysis of maturation marker expression in naive DC cocultured with virus-infected DC either directly or in a transwell system. a, b Naive DC were cocultured directly (direct contact coculture) with either Cal/09- or NC/99-infected DC, at a ratio of 1:1. Alternatively, naive DC were cocultured in a transwell system (transwell-separated coculture) with either Cal/09-infected or NC/99-infected DC across the membrane at a ratio of 1:1. Cells were stained 18 h after infection for HLA-DR, HLA-ABC, CD40, CD80, CD86, CCR7, and NP, and analyzed by flow cytometry. Maturation marker expression was measured in NP-negative cells (Supplementary Fig. 7) in order to distinguish between infected and uninfected cells in the direct contact coculture. Mock-infected DC served as a negative control. a shows representative flow cytometry plots; b is a summary plot. Data are representative of three independent experiments using cells from different donors. n = 3 for experimental groups and for controls. ***p < 0.001, ANOVA followed by Tukey’s HSD test, with an additional Bonferroni multiple-testing correction. Values shown are median ± s.e.m
Fig. 6
Fig. 6
The pandemic HA viral segment mediates cell death inhibition. Top, Schematic of wild-type and recombinant IAVs. The genomic segments of pandemic Cal/09 and seasonal NC/99 IAV are indicated with green and red lines, respectively. a, b DC were either mock-infected or infected with various IAV constructs for 8 h. c DC were either mock-infected or infected with various IAV constructs for 2 h, and then transfected with poly I:C for 6 h. d Phylogenetic analysis showing HA sequence similarity in cell death-inhibiting or cell death-inducing IAV strains. ad Percentage of cell death was determined by imaging flow cytometry. Data are representative of three independent experiments using cells from different donors. n = 3 for experimental groups and for controls. ***p < 0.001, ANOVA followed by Tukey’s HSD test. Values shown are median ± s.e.m
Fig. 7
Fig. 7
Pandemic IAV causes reduced T cell proliferation. a, b DC were either mock-infected or infected with the indicated IAVs for 4 h, cocultured with naive autologous DC for 4 h, and cocultured with CFSE-labeled allogeneic T cells for 3.5 days. c, d DC were either mock-infected or infected with the indicated IAVs for 2 h, transfected with poly I:C (4 μg/ml) for 2 h, cocultured with naive autologous DC for 4 h, and then cocultured with CFSE-labeled allogeneic T cells for 3.5 days. Percentage of proliferated T cells was determined by flow cytometry. T cells incubated with anti-CD3/CD28-coated beads served as a positive control. a, c are summary plots; b, d are representative flow cytometry plots from a replicate. e Blood CD8+ T cell surrogate proportion variables (SPV) following symptomatic seasonal or pandemic IAV infection in humans were determined computationally. For the seasonal Bri/07 infection study, samples from all 9 subjects at two time points before infection (Baseline) were analyzed together; likewise, samples from nine subjects at 45.5, 53, and 60 h after infection (near the peak of influenza-induced symptoms; Onset), were analyzed jointly. Single dots represent individual data points. The three low-value outlier points post infection are from the same subject. Whether the outliers are excluded from the joint analysis, or data at each time point are analyzed separately, the results remain the same as in the joint analysis. The Cal/09 data represent analysis of a single preinfection sample and a single symptom onset sample coming from 45 subjects infected with the influenza virus. f Schematic illustrating the distinct effects of seasonal IAV and seasonal HA–chimeric IAV, as compared to pandemic IAV and pandemic HA–chimeric IAV, on the induction of necroptosis in infected DC, the subsequent maturation of uninfected DC, and its impact on T cell proliferation/activation. DAMPs, danger-associated molecular patterns. ae Data are representative of three independent experiments using cells from different donors. n = 3 for experimental groups and for controls. ***p < 0.001, ANOVA followed by Tukey’s HSD test, with an additional Bonferroni multiple-testing correction for summarized data; ****p < 10−13, F-test. Values shown are median ± s.e.m

Similar articles

Cited by

References

    1. Taubenberger JK, Morens DM. The pathology of influenza virus infections. Annu. Rev. Pathol. 2008;3:499–522. doi: 10.1146/annurev.pathmechdis.3.121806.154316. - DOI - PMC - PubMed
    1. Lee N, et al. Cytokine response patterns in severe pandemic 2009 H1N1 and seasonal influenza among hospitalized adults. PLoS ONE. 2011;6:e26050. doi: 10.1371/journal.pone.0026050. - DOI - PMC - PubMed
    1. de Jong MD, et al. Fatal outcome of human influenza A (H5N1) is associated with high viral load and hypercytokinemia. Nat. Med. 2006;12:1203–1207. doi: 10.1038/nm1477. - DOI - PMC - PubMed
    1. Marazzi I, Garcia-Sastre A. Interference of viral effector proteins with chromatin, transcription, and the epigenome. Curr. Opin. Microbiol. 2015;26:123–129. doi: 10.1016/j.mib.2015.06.009. - DOI - PubMed
    1. Ayllon J, Garcia-Sastre A. The NS1 protein: a multitasking virulence factor. Curr. Top. Microbiol. Immunol. 2015;386:73–107. - PubMed

Publication types

MeSH terms

Substances