. 2017 Dec 19;114(51):13394-13399.
doi: 10.1073/pnas.1712555114. Epub 2017 Dec 1.

Metabolic activity induces membrane phase separation in endoplasmic reticulum

Affiliations

Metabolic activity induces membrane phase separation in endoplasmic reticulum

Yihui Shen et al. Proc Natl Acad Sci U S A. .

Abstract

Membrane phase behavior has been well characterized in model membranes in vitro under thermodynamic equilibrium state. However, the widely observed differences between biological membranes and their in vitro counterparts are placing more emphasis on nonequilibrium factors, including influx and efflux of lipid molecules. The endoplasmic reticulum (ER) is the largest cellular membrane system and also the most metabolically active organelle responsible for lipid synthesis. However, how the nonequilibrium metabolic activity modulates ER membrane phase has not been investigated. Here, we studied the phase behavior of functional ER in the context of lipid metabolism. Utilizing advanced vibrational imaging technique, that is, stimulated Raman scattering microscopy, we discovered that metabolism of palmitate, a prevalent saturated fatty acid (SFA), could drive solid-like domain separation from the presumably uniformly fluidic ER membrane, a previously unknown phenomenon. The potential of various fatty acids to induce solid phase can be predicted by the transition temperatures of their major metabolites. Interplay between saturated and unsaturated fatty acids is also observed. Hence, our study sheds light on cellular membrane biophysics by underscoring the nonequilibrium metabolic status of living cell.

Keywords: Raman imaging; endoplasmic reticulum; fatty acid; lipid metabolism; membrane phase.


Conflict of interest statement

The authors declare no conflict of interest.

Figures

Fig. 1.
Fig. 1.
Palmitate promotes synthesis and accumulation of saturated lipids. Alteration in major lipids after treatment by palmitate for 20 min, 1 h, 5 h, and 8 h. Change in amount between palmitate treated and control was calculated. Diagram shows top ranks in increase or decrease. CE, cholesterol ester; Cer, ceramide; DG, diacylglyceride; MG, monoacylglyceride; PA, phosphatidic acid; PC, phosphatidylcholine; PE, phosphatidylethanolamine; PI, phosphatidylinositol; PS, phosphatidylserine; SM, sphingomyeline; TG, triacylglyceride. Data are presented as mean ± SEM.
Fig. 2.
Fig. 2.
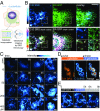
Vibrational imaging reveals new dynamic structures formed by palmitate metabolites. (A) Illustration of isotope-SRS imaging: deuterium-labeled palmitate (d-palmitate) is metabolically incorporated into cellular lipids. The C–D bond vibration of the resulting metabolites is specifically detected by SRS microscopy. (B) ER-GFP–expressing HeLa cell was treated by 400 μM d-palmitate for 4 h. Top row shows 2D projection of ER-GFP fluorescence, C–D SRS, and their overlay. C–D SRS channel is pseudocolored cyan hot to show the full dynamic range of signal. Bottom row shows depth–color-coded image of ER-GFP and C–D SRS, and the magnified view of boxed regions. (C) C–D SRS images of HeLa cells treated with palmitate at varying dose (10∼400 μM) and time (1∼20 h). Four hundred micromolar fatty acid was used in this study, if not specified. (D) HeLa cells were pulse-chase treated with 4-h palmitate and 2-h d-palmitate, fixed, and washed by 0.5% Triton X-100. Two-color images are shown for C–H and C–D channels. (E) The clearance of palmitate-derived structures after removal of palmitate. HeLa cells were pulse-chase treated by 4-h palmitate and 1-h d-palmitate to better delineate the structures. Then palmitate was removed and C–D SRS image was taken at indicated time. (Scale bars: 10 μm; Inset, 2 μm.) Note: High-resolution images are available in the online full text version.
Fig. 3.
Fig. 3.
Image quantification and analysis reveals membrane features of palmitate-derived structure. (A) C–D SRS, Nile Red fluorescence, and overlay images of HeLa cell treated with d-palmitate for 1 h and stained by Nile Red. Yellow arrows indicate LDs stained by Nile Red. On the Right, magnified images are shown for the boxed area. Intensity line profiles are plotted for both channels between the white triangles. (B) HeLa cell was treated with d-palmitate for 5 h. Orthogonal views of a representative non-LD palmitate-derived structure from depth-resolved reconstructed image are shown. (C) Cartoon showing a planar bilayer illuminated in laser focus. (D) Line profiles of C–D SRS image with overlapping layers of palmitate metabolites. (E) Pairwise distribution function was calculated for these line profiles, which show oscillating patterns that indicate constant intensity spacing. (Scale bars: major, 10 μm; Inset, 2 μm.)
Fig. 4.
Fig. 4.
Fluorescent membrane markers reveal lateral separation of palmitate-derived membrane domains in the ER. (A) Chemical structure of fluorescent analog, BODIPY-C12. (B) COS-7 cell was treated with d-palmitate and 2 μM BODIPY-C12 for 5 h. C–D SRS and BODIPY fluorescence are shown. (C) Magnified view is shown for a large sheet. Intensity profiles of the dashed line are shown for both SRS (red) and fluorescence (green) channels. (D) mCherry-Sec61β–expressing COS-7 cell was treated with d-palmitate for 4 h. C–D SRS and Sec61β fluorescence are shown. (E) Magnified view is shown for the boxed area in D. Intensity profiles of both SRS (red) and fluorescence (green) channels are shown for the dashed line in D. In C and E, dark gray stripes indicate two layers of palmitate-derived membrane. (Scale bars: major, 10 μm; Inset, 2 μm.) Note: High-resolution images are available in the online full text version.
Fig. 5.
Fig. 5.
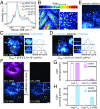
Palmitate-derived membrane domains exhibit solid-like properties as high conformational order and low translational mobility. (A) Normalized Raman spectra of d62-DPPC dispersion (at 25 and 42 °C) and d31-POPC dispersion (at 25 °C) overlaid with Raman spectra of HeLa cells treated with d-palmitate for 5 h (acquired at 25 and 37 °C). Arrowheads mark peak (2,101 cm−1) and shoulder (2,168 cm−1) frequencies used for spectral imaging in B. (B) Calculated C–D SRS ratiometric image of 2,101/2,168 cm−1 for HeLa cells treated with d-palmitate for 3 h. Magnified images are shown on the Right. (C) C–D SRS images of HeLa cell sequentially treated with d-palmitate (3 h), palmitate (1.5 h), and d-palmitate (0.5 h). Intensity profiles (blue) were measured across the yellow lines in regions of interest and fitted with Gaussian function (gray dashed). The estimated maximum diffusion coefficient (Dmax) is shown below (mean ± SEM; n = 13). (D) Similar to the sequential treatment in C, d-stearate (1 h), stearate (1.5 h), and d-stearate (0.5 h) were used instead on palmitate. Dmax is shown below (mean ± SEM; n = 21). (E) Domain collision (arrows) captured in cells treated as in C. (F) HeLa cell was treated with d-palmitate for 1 h. CH2 and C–D SRS images were taken before (Left column) and after (Right column) being washed by 0.5% Triton X-100 for 10 min at 4 °C. (G and H) Changes in low-Tm (G) and high-Tm (H) lipid concentration in total lipid extract or detergent-resistant lipid fraction (DRM) after palmitate treatment for 5 h. Major species DG, PA, PI, PC, PE, and PS are included in quantification. Data are presented as mean ± SD. (Scale bars: 10 μm.)
Fig. 6.
Fig. 6.
The tendency to form solid-like membrane can be tuned by fatty acid identity and combination. (A) C–D SRS, Nile Red fluorescence, and overlay images of HeLa cell treated with d-oleate for 1 h and stained by Nile Red. (B) C–D SRS images of HeLa cells treated with C12:0 (15 h), C14:0 (7 h), C16:0 (5 h), and C18:0 (2 h). (C) Normalized cell number after treatment of designated fatty acid and duration. Data are presented as mean ± SEM; n = 4. *P < 0.05; ***P < 0.005; ****P < 0.001. (D) C–D SRS images of HeLa cells treated with combination of d-palmitate and increasing concentrations of oleate. (E) Changes in low-Tm and high-Tm lipid concentration in cells cotreated by 400 μM palmitate and 200 μM oleate (P + O) compared with 400 μM palmitate alone (P). Data are presented as the amount difference between “P + O” and “P” ([P + O] − [P]) in total lipid extract (total) and detergent-resistant fraction (DRM). (Scale bars: 10 μm.)

Similar articles

Cited by

References

    1. van Meer G, Voelker DR, Feigenson GW. Membrane lipids: Where they are and how they behave. Nat Rev Mol Cell Biol. 2008;9:112–124. - PMC - PubMed
    1. de Almeida RFM, Fedorov A, Prieto M. Sphingomyelin/phosphatidylcholine/cholesterol phase diagram: Boundaries and composition of lipid rafts. Biophys J. 2003;85:2406–2416. - PMC - PubMed
    1. Simons K, Sampaio JL. Membrane organization and lipid rafts. Cold Spring Harb Perspect Biol. 2011;3:a004697. - PMC - PubMed
    1. Jacobson K, Mouritsen OG, Anderson RGW. Lipid rafts: At a crossroad between cell biology and physics. Nat Cell Biol. 2007;9:7–14. - PubMed
    1. Omura T, Siekevitz P, Palade GE. Turnover of constituents of the endoplasmic reticulum membranes of rat hepatocytes. J Biol Chem. 1967;242:2389–2396. - PubMed

Publication types