. 2017 Dec 1;8(1):1882.
doi: 10.1038/s41467-017-01693-z.

Multiplex single-cell visualization of nucleic acids and protein during HIV infection

Affiliations

Multiplex single-cell visualization of nucleic acids and protein during HIV infection

Maritza Puray-Chavez et al. Nat Commun. .

Abstract

Technical limitations in simultaneous microscopic visualization of RNA, DNA, and proteins of HIV have curtailed progress in this field. To address this need we develop a microscopy approach, multiplex immunofluorescent cell-based detection of DNA, RNA and Protein (MICDDRP), which is based on branched DNA in situ hybridization technology. MICDDRP enables simultaneous single-cell visualization of HIV (a) spliced and unspliced RNA, (b) cytoplasmic and nuclear DNA, and (c) Gag. We use MICDDRP to visualize incoming capsid cores containing RNA and/or nascent DNA and follow reverse transcription kinetics. We also report transcriptional "bursts" of nascent RNA from integrated proviral DNA, and concomitant HIV-1, HIV-2 transcription in co-infected cells. MICDDRP can be used to simultaneously detect multiple viral nucleic acid intermediates, characterize the effects of host factors or drugs on steps of the HIV life cycle, or its reactivation from the latent state, thus facilitating the development of antivirals and latency reactivating agents.


Conflict of interest statement

The authors declare no competing financial interests.

Figures

Fig. 1
Fig. 1
Visualizing HIV nucleic acids. a vRNA (top panel): TZM-bl cells were infected with HIV-1 at a multiplicity of infection (MOI) of 1; at 5 hpi cells were fixed and stained. Prior to RNA labeling, cells were treated with buffer alone, RNase A or DNase I. Probe set 1 or PS-1 was used for vRNA (green); nuclei are DAPI stained and shown in blue throughout the figure. vDNA (bottom panel): Prior to DNA labeling cells were treated with RNase A or RNase H followed by DNase I. Probe set PS-3 was used for vDNA (red). b Simultaneous detection of vRNA and vDNA of incoming virus in the cytoplasm. TZM-bl cells were infected with HIV-1 at an MOI of 1; at 4 hpi cells were fixed and stained for vRNA (PS-2; green), vDNA (PS-3; red), and nuclei (blue). Enlarged image shows co-localization between vRNA and vDNA. Scale bars represent 10 µm
Fig. 2
Fig. 2
Time course of vRNA detection. a TZM-bl cells were infected with HIV-1 at an MOI of 0.2. Cells were then fixed and stained at the indicated times. Cells were stained for vRNA (PS-1; green) and nuclei (blue). At 12 hpi, ~15% of infected cells exhibited a transcription burst (12 h, i) whereas most cells did not yet produce nascent vRNA (12 h, ii). Scale bars represent 10 µm. b Foci of vRNA were counted in 300–340 cells per time point, using Gen5 software. The average number vRNA foci per cell was calculated and shown in the graph with standard deviation indicated (n = 2 independent experiments)
Fig. 3
Fig. 3
Time course of vDNA detection. a TZM-bl cells were infected with HIV-1 at an MOI of ~0.2; at indicated times, cells were fixed and stained for vDNA (PS-3; red) and nuclei (blue). Scale bars represent 10 µm. b Foci of vDNA were counted in 300–340 cells per time point, using Gen5 software. The average number of vDNA foci per cell was calculated and shown in the graph with standard deviation indicated (n = 3 independent experiments, except for 24 h time point, where n = 2)
Fig. 4
Fig. 4
Transcription and splicing of vRNA. a Nascent vRNA transcribed from nuclear vDNA in primary cells. Viral transcription site is indicated with a white arrow and appears in yellow because of newly formed vRNA (PS-2; green) and vDNA (PS-3; red) co-localization. Separate red and green channels are shown to the right. PBMCs were infected at an MOI of 0.2; at 48 hpi they were fixed and stained. b HIV-1 transcriptional burst phenotype. TZM-bl cells were infected at an MOI of 0.2; at 12 hpi they were fixed and stained with for unspliced vRNA (PS-1; green) and nuclei (blue). c Multiplex detection of total and unspliced vRNA informs temporal differences in localization. TZM-bl cells were infected with HIV-1 at an MOI of 0.5. At the indicated times, cells were fixed and stained with PS-4 for total vRNA (spliced and unspliced; PS-4; red), unspliced vRNA (PS-1; green), and nuclei (outline). d Spliced and unspliced vRNA were quantified for the whole field of view and within the nuclei. 200–300 cells per time point were analyzed using Gen5 software to measure the total fluorescence signal (the sum of the pixel intensities) per cell, either in the complete field of view (whole cell), or within a nuclear mask (nuclear). Scale bars represent 10 µm
Fig. 5
Fig. 5
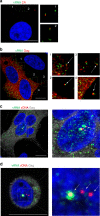
Multiplex visualization of HIV-1 nucleic acids and protein. a Examples of colocalized vRNA and capsid (CA). TZM-bl cells were infected with HIV-1 at an MOI of 0.2; at 2 hpi cells were fixed and stained for unspliced vRNA (PS-1; green), CA (red) and nuclei (blue). Enlarged images indicate co-localization between genomic vRNA of incoming virus and CA. b Apparent formation of nascent virions. TZM-bl cells were infected with HIV-1 at an MOI of 0.2; at 24 hpi cells were fixed and stained for vRNA (PS-1; green), Gag (red), and nuclei (blue). Arrows indicate putative virions. c Multiplex visualization of transcribed vRNA (PS-2; green) from vDNA (PS-3; red, indicated by white arrows) and of translated Gag (gray). TZM-bl cells were infected with HIV-1 at an MOI of 2; at 30 hpi cells were fixed and stained. d Discordant expression from nuclear vDNA sites. Jurkat cells were infected with HIV-1 at an MOI of 2; at 24 hpi cells were fixed and stained for vRNA (PS-2; green), vDNA (PS-3; red, indicated with white arrows), Gag (gray), and nuclei (blue). Images were captured with an LSM 880 confocal microscope. Scale bars represent 10 µm
Fig. 6
Fig. 6
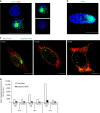
Tracking the early stages of infection of Primary CD4+ T cells. Primary CD4+ T cells were isolated from PBMCs, activated, and infected with HIV-1 NL4–3 at an MOI of 0.05. Cells were then fixed and stained at the indicated times. a Cells were stained for vRNA (PS-4; green), vDNA (PS-3; red) and nuclei (blue). Foci of vRNA and vDNA were counted in 1500–3500 cells per time point (4–24 h) or 500–1000 cells (no virus control and 72 h). Foci were counted in the complete field of view (whole cell), or within a nuclear mask (nuclear). b Number of vRNA and vDNA foci per cell of two independent experiments were calculated. Number of total vDNA foci or vDNA foci within nuclei (nuclear) are also shown. c Staining of vDNA was repeated with RNase A treatment. d Peak values for foci of vRNA, vDNA, nuclear vDNA, and transcriptionally active cells were calculated, to allow determination of the efficiency of each stage in the infection process. Scale bars represent 10 µm
Fig. 7
Fig. 7
MICDDRP analysis of HIV-1/HIV-2 viral coinfection. TZM-bl cells were infected with HIV-1 and HIV-2 at MOIs of 0.5 and 1, respectively. At 24 hpi cells were fixed and stained for HIV-1 (PS-2; green) and HIV-2 (PS-5; red) vRNA, and nuclei (blue). Images were captured with a an Olympus IX81 microscope, or b a Leica STED super-resolution system. Scale bars represent 10 µm

Similar articles

Cited by

References

    1. Di Primio C, et al. Single-cell imaging of HIV-1 provirus (SCIP) Proc. Natl Acad. Sci. 2013;110:5636–5641. doi: 10.1073/pnas.1216254110. - DOI - PMC - PubMed
    1. Peng K, et al. Quantitative microscopy of functional HIV post-entry complexes reveals association of replication with the viral capsid. Elife. 2014;3:e04114. doi: 10.7554/eLife.04114. - DOI - PMC - PubMed
    1. Stultz RD, Cenker JJ, McDonald D. Imaging HIV-1 genomic DNA from entry through productive infection. J. Virol. 2017;91:JVI.00034–17. doi: 10.1128/JVI.00034-17. - DOI - PMC - PubMed
    1. Marini B, et al. Nuclear architecture dictates HIV-1 integration site selection. Nature. 2015;521:227–231. doi: 10.1038/nature14226. - DOI - PubMed
    1. Chin CR, et al. Direct visualization of HIV-1 replication intermediates shows that Capsid and CPSF6 modulate HIV-1 intra-nuclear invasion and integration. Cell Rep. 2015;13:1717–1731. doi: 10.1016/j.celrep.2015.10.036. - DOI - PMC - PubMed

Publication types