. 2017 Dec 1;8(1):1887.
doi: 10.1038/s41467-017-01739-2.

Schwann cell TRPA1 mediates neuroinflammation that sustains macrophage-dependent neuropathic pain in mice

Affiliations

Schwann cell TRPA1 mediates neuroinflammation that sustains macrophage-dependent neuropathic pain in mice

Francesco De Logu et al. Nat Commun. .

Abstract

It is known that transient receptor potential ankyrin 1 (TRPA1) channels, expressed by nociceptors, contribute to neuropathic pain. Here we show that TRPA1 is also expressed in Schwann cells. We found that in mice with partial sciatic nerve ligation, TRPA1 silencing in nociceptors attenuated mechanical allodynia, without affecting macrophage infiltration and oxidative stress, whereas TRPA1 silencing in Schwann cells reduced both allodynia and neuroinflammation. Activation of Schwann cell TRPA1 evoked NADPH oxidase 1 (NOX1)-dependent H2O2 release, and silencing or blocking Schwann cell NOX1 attenuated nerve injury-induced macrophage infiltration, oxidative stress and allodynia. Furthermore, the NOX2-dependent oxidative burst, produced by macrophages recruited to the perineural space activated the TRPA1-NOX1 pathway in Schwann cells, but not TRPA1 in nociceptors. Schwann cell TRPA1 generates a spatially constrained gradient of oxidative stress, which maintains macrophage infiltration to the injured nerve, and sends paracrine signals to activate TRPA1 of ensheathed nociceptors to sustain mechanical allodynia.


Conflict of interest statement

The authors declare no competing financial interests.

Figures
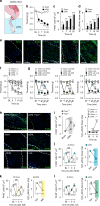
Fig. 1
Fig. 1
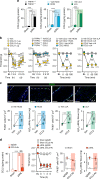
TRPA1 mediates pSNL-evoked allodynia and neuroinflammation. a Drawing representing the pSNL surgery in mice. be Time-dependent (3–20 days, d) mechanical allodynia (b), number and representative images of macrophages (F4/80+ cells) (c, e) and H2O2 content (d) in the sciatic nerve trunk induced by pSNL in C57BL/6 compared to sham mice (n = 6, *P < 0.005, **P < 0.01 ***P < 0.001 pSNL vs. Sham; two-way ANOVA followed by Bonferroni post hoc analyses and unpaired two-tailed Student’s t-test). f Time-dependent (3–20 d) mechanical allodynia in sham/pSNL Trpa1 +/+/Trpa1 −/− mice (n = 8, ***P < 0.001 pSNL+/+ vs. Sham+/+; n = 6, § P < 0.05 and §§§ P < 0.001 pSNL−/− vs. pSNL+/+; two-way ANOVA followed by Bonferroni post hoc analyses). g Mechanical allodynia (at day 10 after surgery) in sham/pSNL mice after HC-030031 (HC03, 100 mg kg−1, i.p.), A-967079 (A96, 100 mg/kg, i.p.) and α-lipoic acid (αLA, 100 mg kg−1, i.p.) or respective vehicles (veh, 4% DMSO and 4% tween 80 in isotonic saline) (n = 6, ***P < 0.001 pSNL veh vs. Sham veh; §§§ P < 0.001 pSNL-HC03, A96 or αLA vs. pSNL-veh; two-way ANOVA followed by Bonferroni post hoc analyses). hl Representative images, number of F4/80+ cells, and H2O2 content in the sciatic nerve of sham/pSNL Trpa1 +/+/Trpa1 −/− and C57BL/6 mice, before (BL) and 1–6 h after HC03, A96, αLA (all, 100 mg kg−1, i.p.) or respective vehicles (veh, 4% DMSO and 4% tween 80 in isotonic saline) (n = 6, **P < 0.01 and ***P < 0.001 pSNL Trpa1 +/+ vs. Sham-Trpa1 +/+ and pSNL veh vs. Sham veh; §§ P < 0.01 and §§§ P < 0.001 pSNL Trpa1 −/− vs. pSNL-Trpa1 +/+ and pSNL HC03, A96 or αLA vs. pSNL-veh; two-way and one-way ANOVA followed by Bonferroni post hoc analyses). (Scale bars: 50 μm; (e, h) dashed lines, perineurium). Data are represented as mean ± s.e.m
Fig. 2
Fig. 2
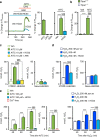
TRPA1 mediates CCL2-evoked allodynia and neuroinflammation. a CCL2 levels in sciatic nerves (at day 10 after surgery) of sham/pSNL Trpa1 +/+/Trpa1 −/− and C57BL/6 mice after HC-030031 (HC03, 100 mg kg−1, i.p.), α-lipoic acid (αLA, 100 mg kg−1, i.p.) or respective vehicles (veh, 4% DMSO and 4% tween 80 in isotonic saline) (n = 6, ***P < 0.001 pSNL-Trpa1 +/+ vs. sham-Trpa1 +/+ and pSNL-veh vs. sham-veh; one-way ANOVA followed by Bonferroni post hoc analyses). b Mechanical allodynia induced by perineural CCL2 (0.1–1 µg) or vehicle (veh, isotonic saline) in C57BL/6 mice (n = 4, ***P < 0.001 veh vs. CCL2 (1 µg), two-way ANOVA followed by Bonferroni post hoc analyses) and CCL2 (1 µg) in Trpa1 +/+/Trpa1 −/− and after HC03, αLA (both, 100 mg/kg, i.p.) or respective vehicles (veh, 4% DMSO and 4% tween 80 in isotonic saline) in C57BL/6 mice (n = 4, ***P < 0.001 Trpa1 +/+ CCL2 vs. Trpa1 +/+veh; CCL2 veh HC03, αLA vs. veh CCL2; §§§ P < 0.001 Trpa1 −/− CCL2 vs. Trpa1 +/+ CCL2 and CCL2 HC03, αLA vs. CCL2 veh HC03, αLA; two-way ANOVA followed by Bonferroni post hoc analyses). c Representative images, F4/80+ cell number and H2O2 content in sciatic nerves of mice treated with perineural CCL2 (1 µg) after HC03, αLA (both, 100 mg kg−1, i.p.) or respective vehicles (veh, 4% DMSO and 4% tween 80 in isotonic saline) (n = 5, ***P < 0.001 CCL2 vs. veh HC03, αLA; §§§ P < 0.001 CCL2 HC03, αLA vs. CCL2 veh HC03, αLA; one-way ANOVA followed by Bonferroni post hoc analyses) (Scale bars: 50 μm, dashed lines indicate perineurium). d CCL2 levels, mechanical allodynia, F4/80+ cell number and H2O2 content in sciatic nerves (at day 10 after surgery) of sham/pSNL C57BL/6 mice after an anti-CCL2 antibody (CCL2-Ab) or IgG2B control (120 µg 200 µl−1, i.p., single administration) (n = 6, ***P < 0.001 pSNL-CCL2-Ab vs. sham-CCL2-Ab; §§§ P < 0.001 pSNL-CCL2-Ab vs. pSNL-IgG2B; one-way ANOVA followed by Bonferroni post hoc analyses). Data are represented as mean ± s.e.m
Fig. 3
Fig. 3
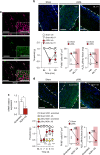
Schwann cells express TRPA1. a Double immunofluorescence staining of TRPA1 and S-100 and SOX10 (two specific markers for detecting Schwann cells), in sciatic nerve from C57BL/6 mice (Scale bars: 50 μm and inset 20 μm). b 3D confocal images of TRPA1 and PGP9.5 staining in Schwann cells from sciatic nerve trunks of C57BL/6 mice (Scale bars: 20 μm). c Triple immunofluorescence staining of S-100, PGP9.5 and TRPA1 in sciatic nerve trunks from C57BL/6 mice (Scale bars: 20 μm and inset 10 μm). d TRPA1 staining in DRGs neurons from Trpa1 +/+ and Trpa1 −/− mice (Scale bars: 50 μm). e 3D confocal image reconstructions of TRPA1 and S100 in Schwann cells from sciatic nerve trunks of Trpa1 +/+ and Trpa1 −/− mice. f TRPA1 and SOX-10 immunoreactivity in cultured C57BL/6 mouse Schwann cells (Scale bars: 50 μm and inset 10 µm). g Representative blot and TRPA1 protein content in cultured Schwann cells and DRGs neurons taken from C57BL/6 mice. Equally loaded protein was checked by expression of β-actin (n = 4 independent experiments). h TRPA1 mRNA relative expression in cultured C57BL/6 mouse Schwann cells (n = 3 replicates from two independent experiments). Data are represented as mean ± s.e.m
Fig. 4
Fig. 4
Schwann cells expressing TRPA1 release H2O2. a Ca2+ responses to AITC (1 mM) in cultured Schwann cells with HC-030031 (HC03, 30µM) or its vehicle (veh, 0.3% DMSO) and to TRPV1- (capsaicin, CPS, 0.5 µM) or TRPV4- (GSK1016790A, GSK, 50 nM) agonists (n = 25 cells from 3 independent experiments, ***P < 0.001 AITC vs. veh; §§§ P < 0.001 HC03 vs. AITC; one-way ANOVA followed by Bonferroni post hoc analyses). b AITC (1 mM)-evoked calcium response in Schwann cells from Trpa1 +/+, but not from Trpa1 −/− mice (n = 25 cells from 3 independent experiments, ***P < 0.001 Trpa1 +/+ AITC vs. Trpa1 +/+ veh; §§§ P < 0.001 Trpa1 −/− AITC vs. Trpa1 +/+ AITC; one-way ANOVA followed by Bonferroni post hoc analyses). c, d H2O2 release from hTRPA1-HEK293 or untransfected (naïve-HEK293) cells induced by AITC (10 µM) or H2O2 (200 nM) and effect of HC03 (30 µM), A-967079 (A96, 30 µM) or respective vehicles (veh, 0.3% DMSO) (n = 8 replicates from three independent experiments, ***P < 0.001 AITC, H2O2 vs. veh; §§§ P < 0.001 AITC, H2O2 + HC03/A96 vs. AITC, H2O2; one-way ANOVA followed by Bonferroni post hoc analyses; H2O2 200 nM per se represents the value of H2O2 over the time, not in presence of cells). e H2O2 release from cultured mouse Schwann cells evoked by AITC (100 µM) or H2O2 (200 nM) and effect of HC03 (30 µM) and Ca2+-free medium (Ca2+-free) (n = 8 replicates from three independent experiments, ***P < 0.001, veh-AITC/H2O2 vs. AITC/H2O2; §§§ P < 0.001 HC03 vs. AITC, H2O2; one-way ANOVA followed by Bonferroni post hoc analyses; H2O2 200 nM per se represents the value of H2O2 without cells). Data are represented as mean ± s.e.m
Fig. 5
Fig. 5
NOX1 blockade inhibited pSNL-evoked allodynia and neuroinflammation. a Images of S100/PGP9.5 and NOX1 immunofluorescence in sciatic nerves (Scale bars: 50 μm and inset 20 μm). b Mechanical allodynia, representative images and F4/80+ cell number, and H2O2 content (at day 10 after surgery) in sham/pSNL mice after NOX1-inhibitor (ML171, 60 mg kg−1, i.p) or vehicle (veh, 4% DMSO and 4% tween 80 in isotonic saline) (n = 6, ***P < 0.001 pSNL-veh vs. sham-veh; §§ P < 0.01 and §§§ P < 0.001 pSNL-ML171 vs. pSNL-veh; two-way ANOVA followed by Bonferroni post hoc analyses) (Scale bars: 50 μm; dashed lines, perineurium). c NOX1 mRNA relative expression in sciatic nerve after perineural NOX1 antisense oligonucleotides (AS-ODN) or scrambled-ODN (both, 10 nmol 10 µl−1) (n = 3 replicates from two independent experiments, *P < 0.05 AS-ODN vs. scrambled-ODN; unpaired two-tailed Student’s t-test). d Mechanical allodynia, representative images and F4/80+ cell number, and H2O2 content (at day 10 after surgery) in sham/pSNL mice after NOX1 AS-ODN or scrambled-ODN (both, 10 nmol 10 µl−1) (n = 6, ***P < 0.001 pSNL-NOX1-scrambled vs. sham-NOX1scrambled; § P < 0.05, §§ P < 0.01 and §§§ P < 0.001 pSNL-NOX1 AS-ODN vs. pSNL-NOX1scrambled; two-way ANOVA followed by Bonferroni post hoc analyses) (Scale bars: 50 μm; dashed lines, perineurium). Data are represented as mean ± s.e.m
Fig. 6
Fig. 6
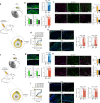
Oxidative stress from Schwann cell TRPA1 recruits macrophages and signal pain in C57BL/6 mice. a, f Schematic representation of perineural/intrathecal injection of TRPA1 antisense/mismatch oligonucleotides (AS/MM-ODN). b, g TRPA1 immunofluorescence (mean gray value) and TRPA1 mRNA relative expression in DRGs and acute nociception after perineural AITC (20 nmol 10 µl−1) or capsaicin (CPS, 1 nmol 10 µl−1) following perineural (10 nmol 10 µl−1) (b) or intrathecal (5 nmol 5 µl−1) (g) TRPA1 AS/MM-ODN treatment (once/day for 4 consecutive days) in C57BL/6 (n = 6, ***P < 0.001 MM/AS AITC, CPS vs. MM/AS veh; §§§ P < 0.001 AS AITC vs. MM AITC; one-way ANOVA followed by Bonferroni post hoc analyses, Scale bars: 20 µm). c, h Representative images (Scale bars: 50 μm; dashed lines, perineurium), (j) colocalization value (Rcoloc) of S100/TRPA1 and mRNA-TRPA1 expression in sciatic nerve after perineural (c) and intrathecal (h) AS/MM-ODN (n = 6, *P < 0.05; ***P < 0.001 AS vs MM; unpaired two-tailed Student’s t-test). d, i Mechanical allodynia, and (e, j) representative images, F4/80+-cells, and H2O2-content (at day 10 after surgery) in sham/pSNL mice after perineural (d, e) and intratechal (i, j) AS/MM-ODN (n = 8, ***P < 0.001 pSNL-MM-ODN vs. sham-MM-ODN; § P < 0.05 and §§§ P < 0.001 pSNL-AS-ODN vs. pSNL-MM-ODN; (d, i) two-way ANOVA followed by Bonferroni post hoc analyses and (e, j) one-way ANOVA followed by Bonferroni post hoc analyses) (Scale bars: 50 μm; dashed lines, perineurium). Data are represented as mean ± s.e.m
Fig. 7
Fig. 7
TRPA1 blockade and antioxidant reduced the number of fluorescent macrophages accumulated at the site of pSNL. a In vivo imaging and quantitative data (NIR area/total ROI) of NIR labeled macrophages (at day 10 after surgery) in sham/pSNL mice at baseline (BL), 1 and 3 h after HC-030031 (HC03, 100 mg kg−1, i.p.) (n = 4, ***P < 0.001 pSNL HC03 vs. pSNL Veh HC03; two-way ANOVA followed by Bonferroni post hoc analyses). b Representative images and F4/80+-cell number surrounding the injured nerve trunk (at day 10 after surgery) of sham/pSNL-mice at BL and 1, 3 and 6 h after HC03 or alpha-lipoic acid (αLA) (both, 100 mg kg−1, i.p.). (n = 4, ***P < 0.001 pSNL vs sham; §§§ P < 0.001 pSNL HC03, αLA vs. pSNL veh; one-way ANOVA followed by Bonferroni post hoc analyses) (Scale bars, 200 µm; inside (in) and outside (out) sciatic nerves). Data are represented as mean ± s.e.m
Fig. 8
Fig. 8
Plp1-Cre/ERT–mediated Trpa1 deletion from Schwann cells prevented the partial sciatic nerve ligation (pSNL)-evoked allodynia and neuroinflammation. a Acute nociception response induced by intraplantar AITC (10 nmol 20 µl−1) or vehicle (veh, 0.5% DMSO) in Plp1-Cre ERT ;Trpa1 fl/fl and control mice (n = 6, ***P < 0.001 AITC vs. veh; one-way ANOVA followed by Bonferroni post hoc analyses). b Triple immunofluorescence staining and colocalization value (Rcoloc) of TRPA1, PGP9.5, and S100 (Scale bars: 20 µm) in sciatic nerve trunks obtained from Plp1-Cre ERT ;Trpa1 fl/fl (n = 5) and control mice (n = 4), (**P < 0.01; Plp1-Cre ERT ;Trpa1 fl/fl vs. control; unpaired two-tailed Student’s t-test). c Ca2+ responses to AITC (1 mM) or vehicle (veh, 1% DMSO) in cultured Schwann cells from sciatic nerve trunks of Plp1-Cre ERT ;Trpa1 fl/fl and control mice (n = 25 cells/two independent experiments, ***P < 0.001 AITC vs. veh; §§§ P < 0.001 AITC Plp1-Cre ERT ;Trpa1 fl/fl vs. AITC control; one-way ANOVA followed by Bonferroni post hoc analyses). d Mechanical allodynia, and (e) representative images, F4/80+ cells, and H2O2 content (at day 10 after surgery) in sham/pSNL Plp1-Cre ERT ;Trpa1 fl/fl and control mice (n = 8, *P < 0.05 and ***P < 0.001 pSNL control vs. sham control; §§ P < 0.01 and §§§ P < 0.001 pSNL Plp1-Cre ERT ;Trpa1 fl/fl vs. pSNL control; (d) two-way ANOVA followed by Bonferroni post hoc analyses and (e) one-way ANOVA followed by Bonferroni post hoc analyses) (Scale bars: 50 μm). Data are represented as mean ± s.e.m
Fig. 9
Fig. 9
Cellular and molecular events contributing to TRPA1-mediated mechanical allodynia and neuroinflammation in a neuropathic pain model. Partial sciatic nerve ligation (pSNL) by releasing CCL2 (a) promotes the extravasation of hematogenous monocytes (b) that, via their rapid NOX2-dependent oxidative burst (red dots) target the TRPA1 channel localized in Schwann cells (c). TRPA1 activation in Schwann cells evokes a Ca2+-dependent, NOX1-mediated (d) prolonged H2O2 (green dots) generation (e) with a dual function. The outward H2O2 release (f) produces a space-scaled gradient that determines the final macrophage influx to the injured nerve trunk, whereas the inward H2O2 release (g) targets nociceptor TRPA1 to produce mechanical allodynia (h). ROS reactive oxygen species

Similar articles

Cited by

References

    1. Jensen TS, et al. A new definition of neuropathic pain. Pain. 2011;152:2204–2205. doi: 10.1016/j.pain.2011.06.017. - DOI - PubMed
    1. van Hecke O, Austin SK, Khan RA, Smith BH, Torrance N. Neuropathic pain in the general population: a systematic review of epidemiological studies. Pain. 2014;155:654–662. doi: 10.1016/j.pain.2013.11.013. - DOI - PubMed
    1. Gaudet AD, Popovich PG, Ramer MS. Wallerian degeneration: gaining perspective on inflammatory events after peripheral nerve injury. J. Neuroinflammation. 2011;8:110. doi: 10.1186/1742-2094-8-110. - DOI - PMC - PubMed
    1. Ramer MS, French GD, Bisby MA. Wallerian degeneration is required for both neuropathic pain and sympathetic sprouting into the DRG. Pain. 1997;72:71–78. doi: 10.1016/S0304-3959(97)00019-5. - DOI - PubMed
    1. von Hehn CA, Baron R, Woolf CJ. Deconstructing the neuropathic pain phenotype to reveal neural mechanisms. Neuron. 2012;73:638–652. doi: 10.1016/j.neuron.2012.02.008. - DOI - PMC - PubMed

Publication types

LinkOut - more resources