. 2018 Jan;19(1):85-97.
doi: 10.1038/s41590-017-0001-2. Epub 2017 Nov 21.

Single-cell analysis reveals the continuum of human lympho-myeloid progenitor cells

Affiliations

Single-cell analysis reveals the continuum of human lympho-myeloid progenitor cells

Dimitris Karamitros et al. Nat Immunol. 2018 Jan.

Abstract

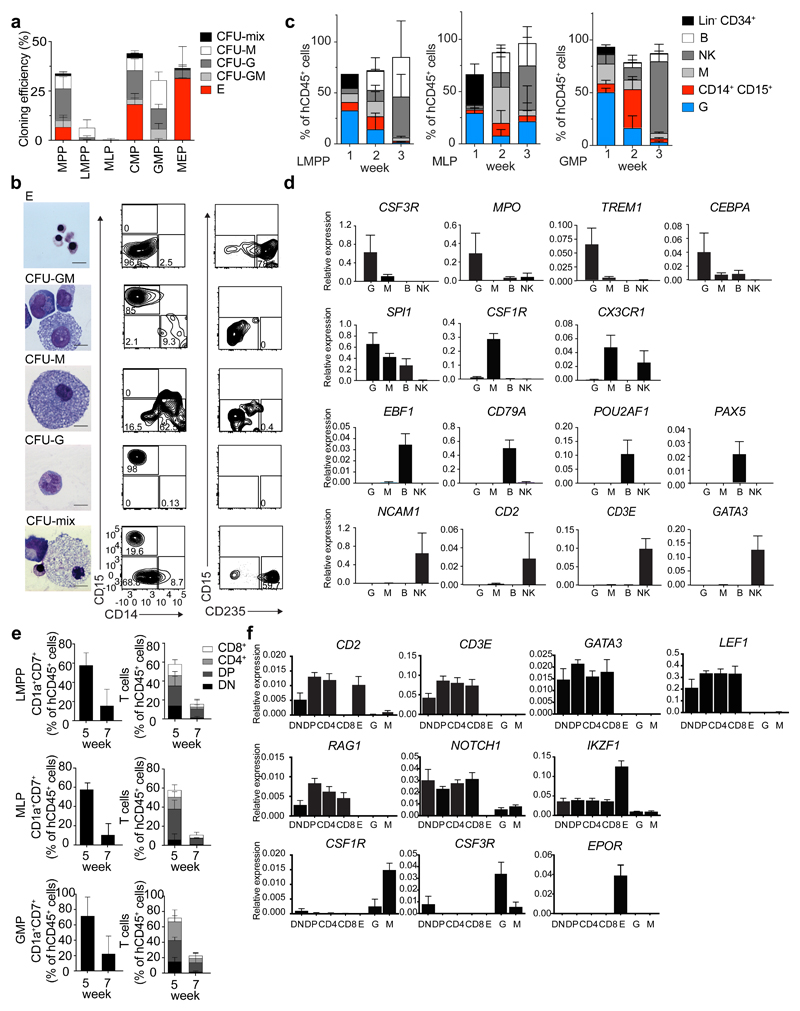
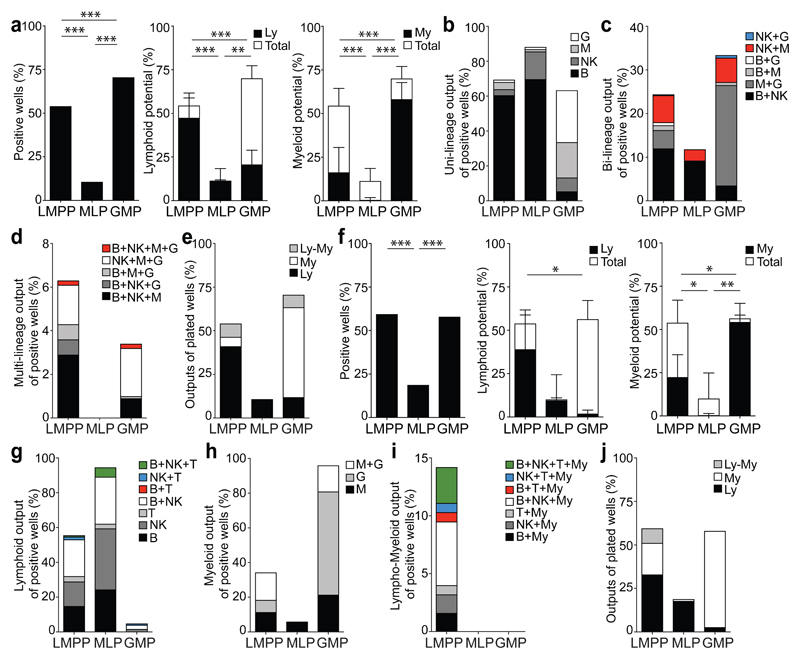
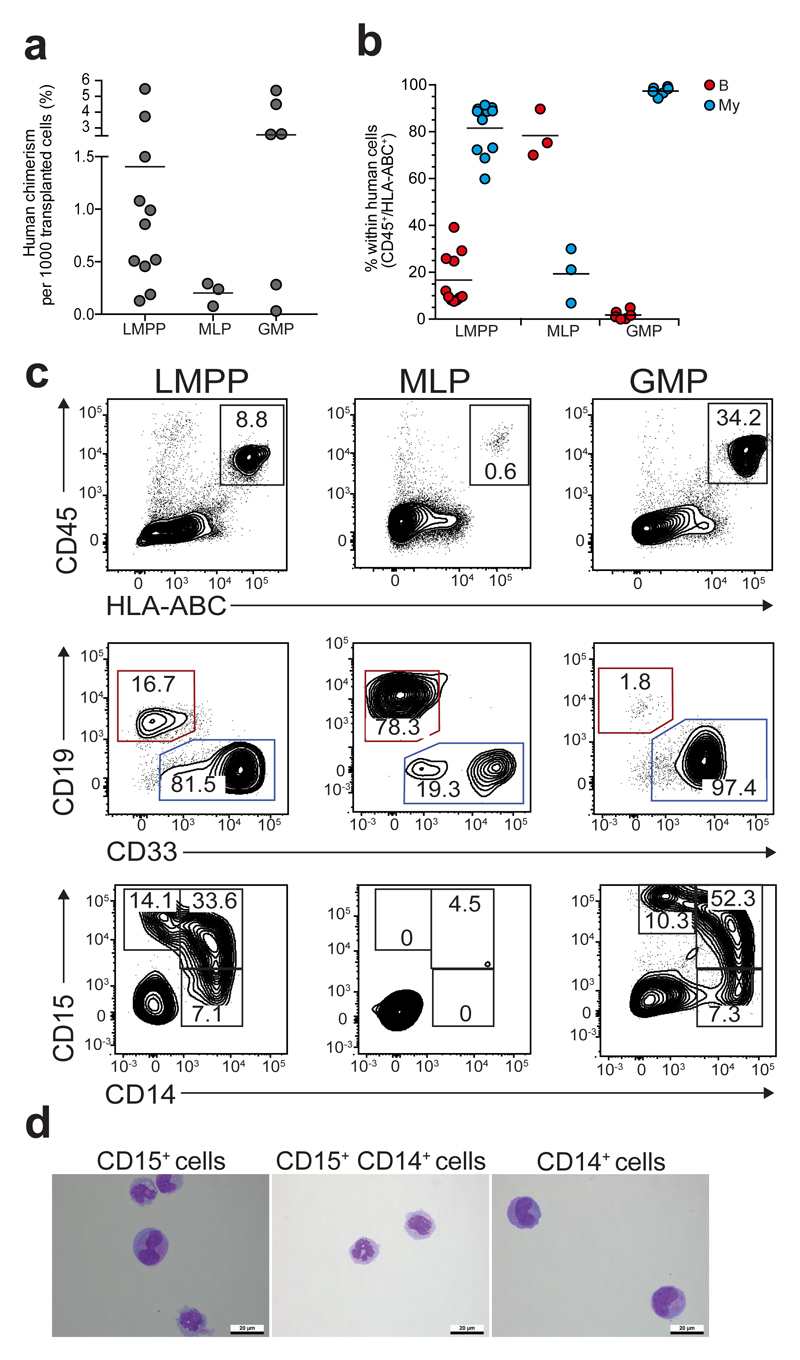
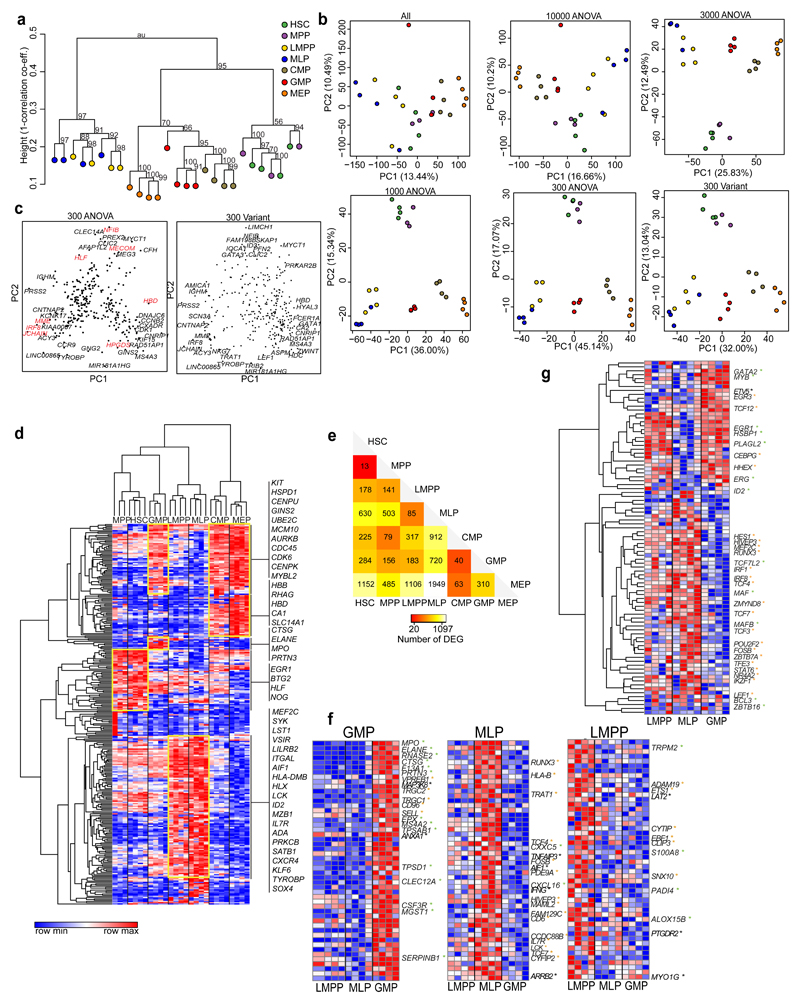
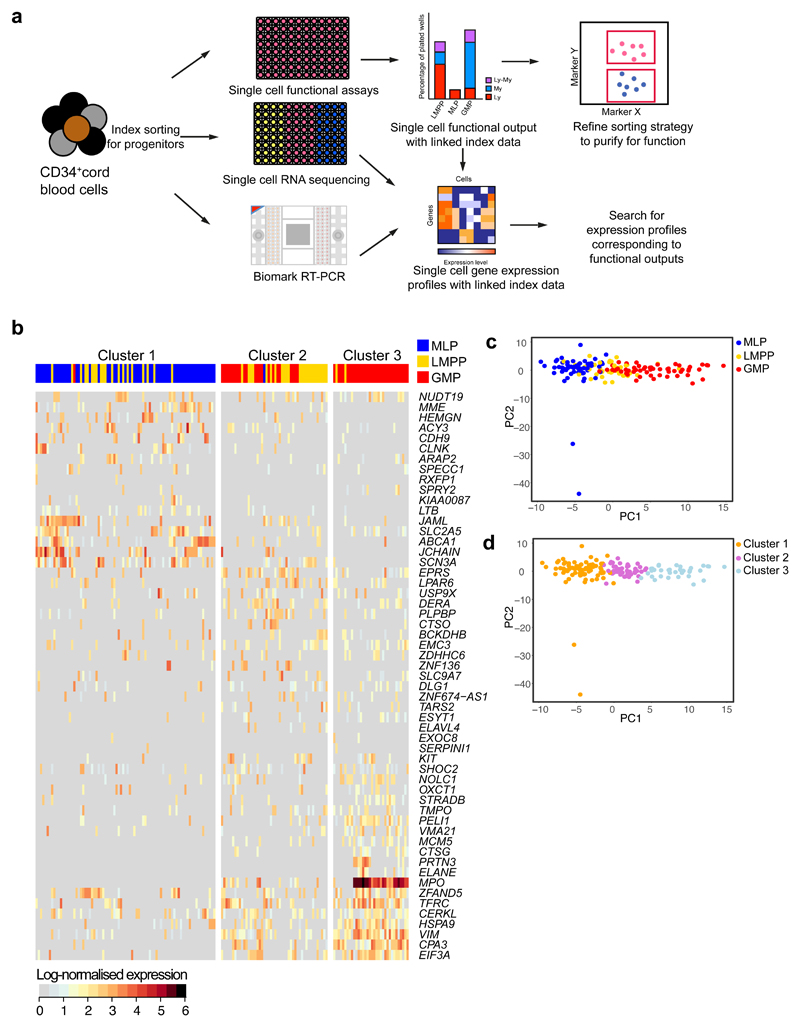
The hierarchy of human hemopoietic progenitor cells that produce lymphoid and granulocytic-monocytic (myeloid) lineages is unclear. Multiple progenitor populations produce lymphoid and myeloid cells, but they remain incompletely characterized. Here we demonstrated that lympho-myeloid progenitor populations in cord blood - lymphoid-primed multi-potential progenitors (LMPPs), granulocyte-macrophage progenitors (GMPs) and multi-lymphoid progenitors (MLPs) - were functionally and transcriptionally distinct and heterogeneous at the clonal level, with progenitors of many different functional potentials present. Although most progenitors had the potential to develop into only one mature cell type ('uni-lineage potential'), bi- and rarer multi-lineage progenitors were present among LMPPs, GMPs and MLPs. Those findings, coupled with single-cell expression analyses, suggest that a continuum of progenitors execute lymphoid and myeloid differentiation, rather than only uni-lineage progenitors' being present downstream of stem cells.


Conflict of interest statement

Competing Financial Interests

Nil

Figures

Figure 1
Figure 1. Human CB lympho-myeloid populations have distinct functional potential in vitro.
(a) Cloning efficiency and lineage affiliation of myelo-erythroid colonies in a CFU assay (150 CB HSPCs plated). Error bars are ± SD. n=5. CFU-mix, mixed erythro-myeloid colony; CFU-M, monocyte/macrophage colony; CFU-G, granulocyte colony; CFU-GM, granulocyte and monocyte/macrophage colony; E, erythroid colony (BFU-E and CFU-E). (b) Morphology of May-Grunwald-Giemsa stained cells from CFU assay (left, bar size 10 µm) and flow cytometric plots of cells harvested from indicated colony types (right). (c) Lineage output after culturing 150 LMPP, MLP and GMP cells for 1, 2 or 3 weeks on MS-5 stroma with SCF, G-CSF, FLT3L, IL15, IL2 and DuP-697. Data represent mean from 3 CB donors ± SD. Flow cytometric plots for two week cultures shown in Supplementary Fig. 1b. (d) Gene expression analysis of flow cytometric-purified output cells from (c). (e) T cell output after culturing LMPP, MLP and GMP cells in bulk for 5 or 7 weeks on OP9-hDL1 stroma with SCF, FLT3L and IL7. Data represent percentage from hCD45+ cells from 5 CB donors (mean± 1SD). DN, CD7+CD1a+ CD4-CD8-; DP, CD7+CD1a+CD4+CD8+; CD4, CD7+CD1a+CD4+CD8-; CD8, CD7+CD1a+CD4-CD8+. Flow cytometric plots for 5 week cultures shown in Supplementary Fig. 1c. (f) Gene expression analysis from flow-purified output cells from (e) and control mature non-T cells, obtained from sorting cells from E, G and M colonies.
Figure 2
Figure 2. CB LMPP and GMP are lympho-myeloid progenitors, while MLP is mainly a lymphoid progenitor in clonal in vitro assays.
(a) Total cloning efficiency (left) of single LMPP, MLP and GMP in SGF15/2 condition (LMPP: 615/1136 cells, MLP: 76/710, GMP: 1145/1622). Significance defined by Fisher’s exact test. Cloning efficiency of lymphoid (Ly, middle) and myeloid lineages (My, right). Bars indicate total cloning efficiency; filled portion indicates the proportion of lymphoid (lymphoid plus mixed) or myeloid potential (myeloid plus mixed clones). Mean ± SD is shown. Significance is defined using students t-test. (b) Single-, (c) bi- and (d) multi-lineage outputs from single cells, presented as a percentage of positive wells in SGF15/2 condition. (e) Lymphoid (Ly), myeloid (My) and lympho-myeloid (Ly-My) outputs presented as a percentage of all plated cells in SGF15/2 condition. (f) Total cloning efficiency (left) of single cell progenitors in SF7b/Dox condition (LMPP: 128/215 cells, MLP: 37/197, GMP: 127/219). Cloning efficiency of lymphoid (middle) and myeloid lineages (right). Bars indicate total cloning efficiency; filled portion indicates the proportion of lymphoid or myeloid potential. Mean ± SD is shown. Significance is defined as in (a). (g) Single-, (h) bi- and (i) multi-lineage outputs from single cells, presented as a percentage of the positive wells in SF7b/Dox condition. (j) Lymphoid (Ly), myeloid (My) and lympho-myeloid (Ly-My) outputs presented as a percentage of all plated cells in SF7b/Dox condition. For the single cell assay in SGF15/2 condition: 22 CB donors; SF7b/Dox condition: 3 CB donors.
Figure 3
Figure 3. Human CB LMPP, MLP and GMP progenitors have distinct differentiation potential in vivo.
(a) Percentage human engraftment 2 weeks after progenitor transplantation, normalized to 1000 transplanted cells. (b) Percentage B and myeloid cells within human CD45+/HLA-ABC+ cells. (c) Representative flow cytometric plots of percentage human engraftment (CD45+HLA-ABC+), B cells (CD19+) and myeloid cells (CD33+), and percentage CD14+ and CD15+ myeloid cells 2 weeks after transplantation. Frequencies shown are an average from 11 CB donors for LMPP, 3 from MLP, 6 for GMP. (d) Representative images of May-Grunwald-Giemsa stained CD15+, CD15+/CD14+ and CD14+ myeloid cells generated by LMPP 2 weeks after transplantation, n=2.
Figure 4
Figure 4. Distinct transcriptional patterns of human CB HSPC populations.
(a) Hierarchical clustering of HSPC populations using all genes and 1000 bootstrap permutation analyses; “au” = approximate unbiased p-values. Height values expressed as (1- [correlation co-efficient]). (b) PCA plots showing CB HSPC when using varying number of ANOVA genes (ranked by ANOVA p-value) and 300 most variant genes (bottom right). Percentage variance represented by each Principal Component (PC) is shown. (c) Loadings plot, showing the genes with the most extreme loadings scores for the PCA run with top 300 ANOVA (top) or variant (bottom) genes. (d) Heatmap showing hierarchical clustering and the expression of the top 300 ANOVA genes by HSPC populations. Clusters highlighted in yellow show distinct expression patterns across HSPC populations. Expression values are normalized per gene. (e) Summary of all differentially expressed genes between HSPC populations. (f-g) Heatmaps showing the expression of top 50 genes from the LMPP, MLP and GMP gene signatures (f) and transcription factors differentially expressed across HSPC populations (g). Genes affiliated with the lymphoid or myeloid lineages have color-coded asterix (lymphoid: orange, myeloid: green) and genes associated with immune function are labeled with black asterix. Expression values are normalized per gene. RNA seq data come from 4 CB donors (MPP: 3 donors).
Figure 5
Figure 5. Transcriptional heterogeneity of CB lympho-myeloid progenitor cells from single cell RNA-sequencing.
(a) Experimental scheme used to combine single cell functional analysis, single cell RNA-sequencing and single cell qRT-PCR based on flow cytometric index data. (b) Heatmap showing clustering of single LMPP, GMP and MLP using the 55 most highly and variably expressed genes between clusters. Heatmap shows clustering from one of two donors analyzed. Data from the other donor are in Supplementary Fig. 5d. Log-normalized gene expression (rows) for each single cell (columns) is shown. (c-d) PCA plot colored by cell type (c) or cluster membership (d).
Figure 6
Figure 6. New flow sorting strategy to purify functional potential within CB LMPP compartment.
(a) Logicle transformed CD10 and CD45RA surface marker levels in LMPPs, grouped by functional output. Ly - uni-lymphoid (B or NK) or bi-lymphoid output (B+NK), My - uni-myeloid (M or G) or bi-myeloid output (M+G), Ly-My - lympho-myeloid output. n=2 CB donors. (b) CD10 and CD45RA expression levels in LMPPs, measured by flow cytometry, colored by output from functional assays. Logicle-transformed data are from 2 CB donors. (c) Revised sorting strategy based on CD10 and CD45RA expression levels defined by bioinformatic analyses. Representative plots from 6 CB donors. (d) Total cloning efficiency (left) of single MLP, LMPP, LMPPly, LMPPmix and GMP in SGF15/2 condition (LMPPly: 56/244 cells, LMPPmix: 152/240). Significance defined using Fisher’s exact test. Cloning efficiency of lymphoid (Ly, middle) and myeloid lineages (My, right). Bars indicate total cloning efficiency; filled portion indicates the proportion of lymphoid potential (lymphoid plus mixed) or myeloid potential (myeloid plus mixed clones). Mean ± SD is shown. Significance is defined using students t-test. (e) Single-, (f) bi- and (g) multi-lineage outputs from single cells in SGF15/2 condition, presented as percentage of the positive wells. (h) Lymphoid (Ly), myeloid (My) and lympho-myeloid (Ly-My) outputs presented as percentage of all plated cells in SGF15/2 condition. (i) Lymphoid (Ly), myeloid (My) and lympho-myeloid (Ly-My) outputs presented as percentage of all plated MLP, LMPP, LMPPly, LMPPmix and GMP cells in SF7b condition. For SGF15/2 condition (d-h) data are from 6 CB donors (for LMPP, MLP and GMP controls - 22 CB donors (the same shown in Fig. 2a-e)). For SF7b condition (i) - 6 CB donors (for LMPP, MLP and GMP 9 CB donors (including 3 CB donors in Fig. 2f-j)).
Figure 7
Figure 7. New flow cytometric sorting strategy to purify functional potential within CB GMP compartment.
(a) Logicle transformed CD38 surface marker expression levels in GMPs, grouped by functional output. n=5 CB donors. (b) CD38 and CD34 levels in GMPs colored by output from functional assays. Data are from 5 CB donors. (c) Revised sorting strategy, based on CD38 expression levels defined by bioinformatic analysis. Representative plots from 4 CB donors. (d) Total cloning efficiency (left) of the single GMP CD38hi, GMP, CD38mid and LMPP (GMPhi: 152/279 cells, CD38mid: 508/693). Significance defined using Fisher’s exact test. Cloning efficiency of lymphoid (Ly, middle) and myeloid lineages (My, right) of single cell GMP CD38hi, GMP, CD38mid and LMPP. Bars indicate total cloning efficiency; filled portion indicates the proportion of lymphoid (lymphoid plus mixed) or myeloid potential (myeloid plus mixed clones). Mean ± SD is shown. Significance is defined using students t-test. (e) Single-, (f) bi- and (g) multi-lineage outputs from single cells, presented as percentage of the positive wells. (h) Lymphoid (Ly), myeloid (My) and lympho-myeloid (Ly-My) outputs presented as a percentage of all plated GMP CD38hi, GMP, CD38mid and LMPP cells. For the functional assays (d-h), data are from 4 CB donors, for LMPP and GMP controls data are from 22 CB donors (the same shown in Fig. 2a-e).

Similar articles

Cited by

References

    1. Dykstra B, et al. Long-term propagation of distinct hematopoietic differentiation programs in vivo. Cell Stem Cell. 2007;1:218–229. - PubMed
    1. Challen GA, Boles NC, Chambers SM, Goodell MA. Distinct hematopoietic stem cell subtypes are differentially regulated by TGF-beta1. Cell Stem Cell. 2010;6:265–278. - PMC - PubMed
    1. Benz C, et al. Hematopoietic stem cell subtypes expand differentially during development and display distinct lymphopoietic programs. Cell Stem Cell. 2012;10:273–283. - PubMed
    1. Chen JY, et al. Hoxb5 marks long-term haematopoietic stem cells and reveals a homogenous perivascular niche. Nature. 2016;530:223–227. - PMC - PubMed
    1. Oguro H, Ding L, Morrison SJ. SLAM family markers resolve functionally distinct subpopulations of hematopoietic stem cells and multipotent progenitors. Cell Stem Cell. 2013;13:102–116. - PMC - PubMed