. 2017 Dec 13;22(6):817-829.e8.
doi: 10.1016/j.chom.2017.10.011. Epub 2017 Nov 16.

Multi-platform 'Omics Analysis of Human Ebola Virus Disease Pathogenesis

Affiliations

Multi-platform 'Omics Analysis of Human Ebola Virus Disease Pathogenesis

Amie J Eisfeld et al. Cell Host Microbe. .

Abstract

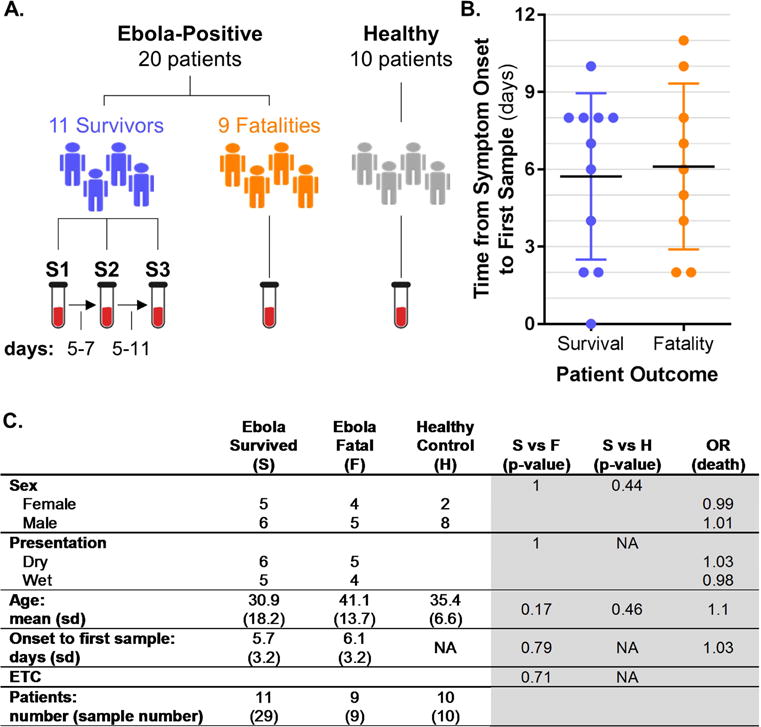
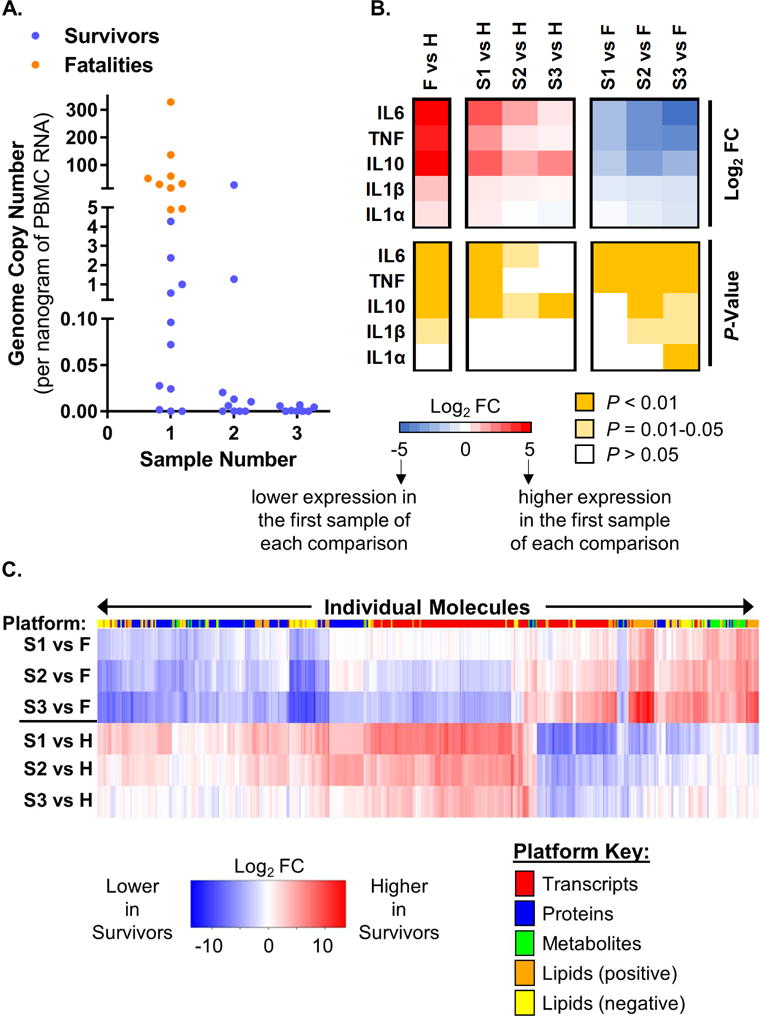
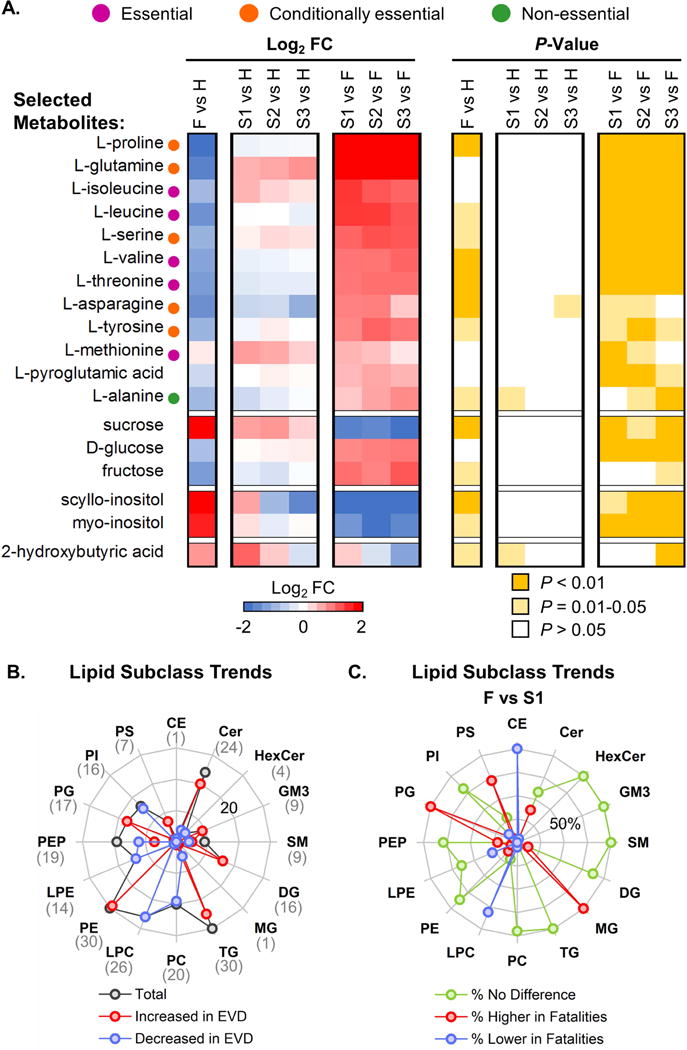
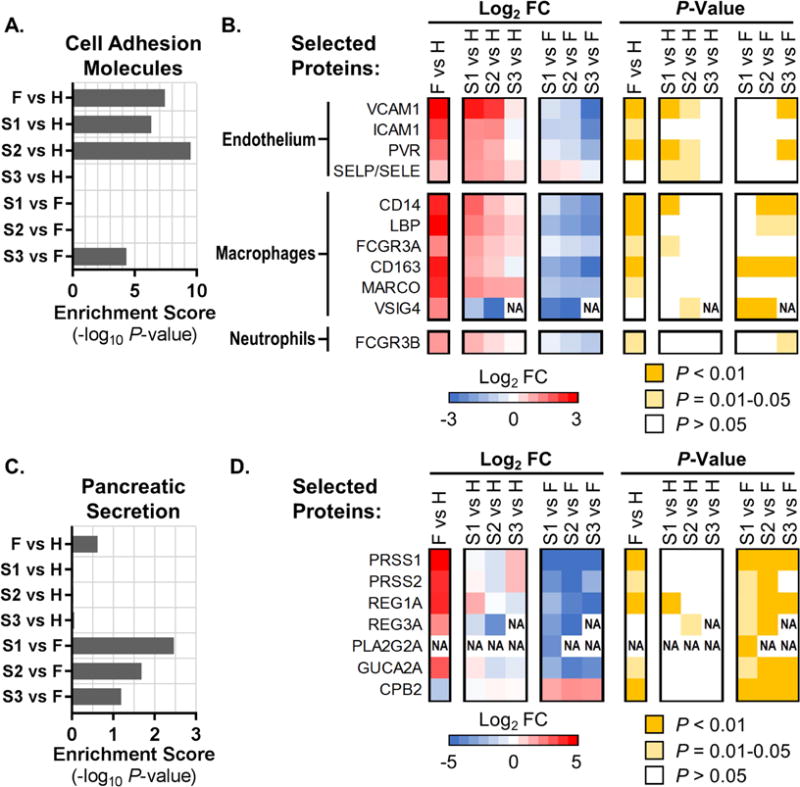
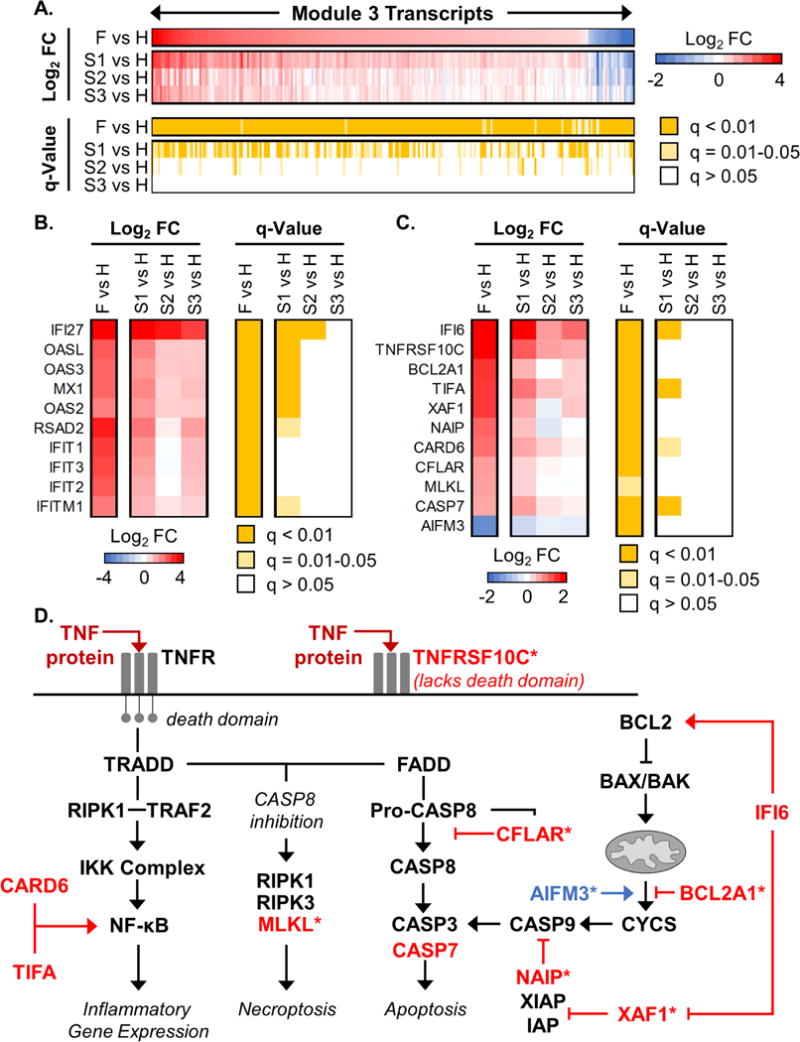
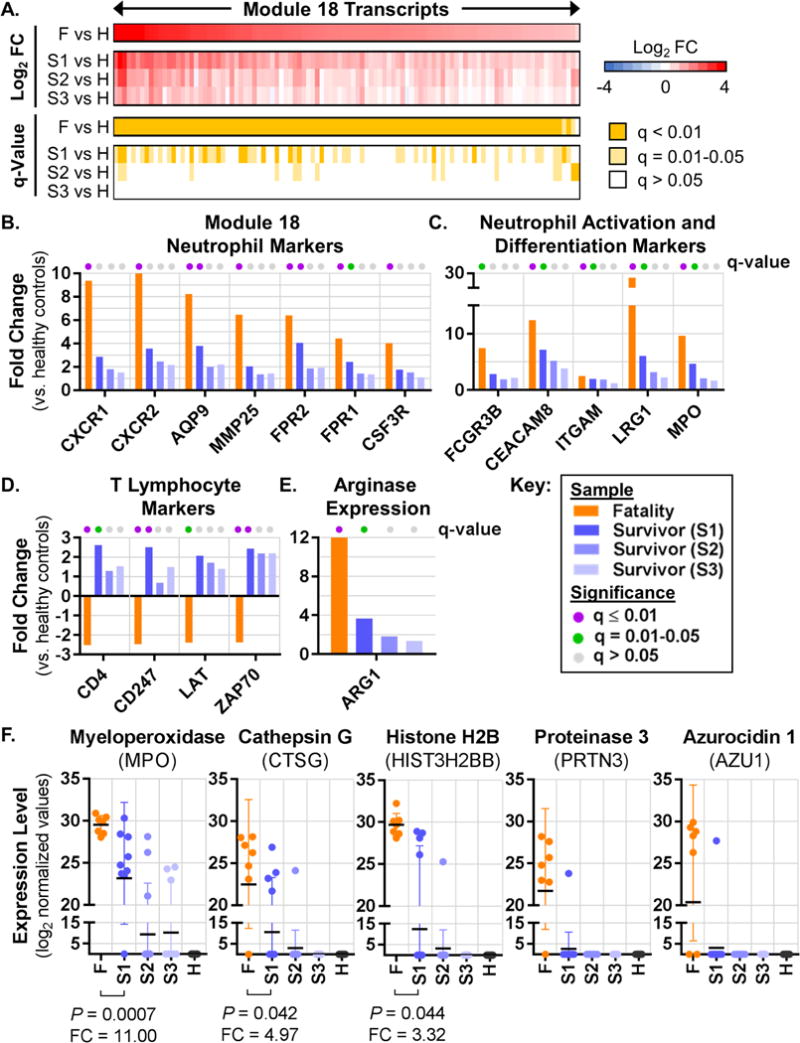
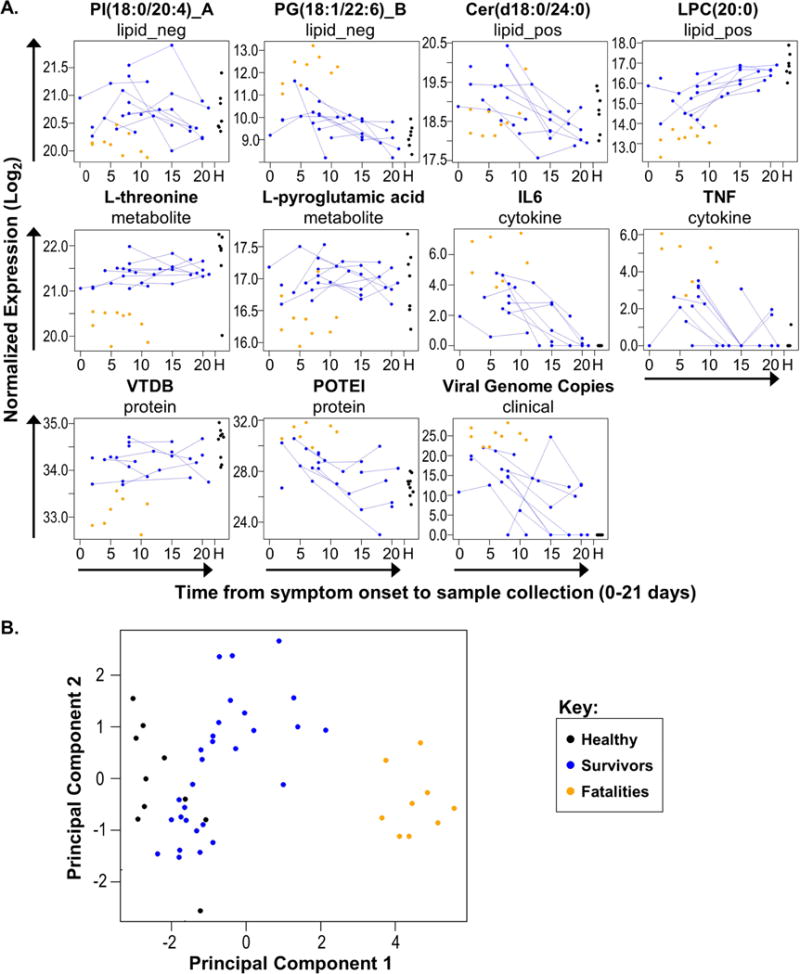
The pathogenesis of human Ebola virus disease (EVD) is complex. EVD is characterized by high levels of virus replication and dissemination, dysregulated immune responses, extensive virus- and host-mediated tissue damage, and disordered coagulation. To clarify how host responses contribute to EVD pathophysiology, we performed multi-platform 'omics analysis of peripheral blood mononuclear cells and plasma from EVD patients. Our results indicate that EVD molecular signatures overlap with those of sepsis, imply that pancreatic enzymes contribute to tissue damage in fatal EVD, and suggest that Ebola virus infection may induce aberrant neutrophils whose activity could explain hallmarks of fatal EVD. Moreover, integrated biomarker prediction identified putative biomarkers from different data platforms that differentiated survivors and fatalities early after infection. This work reveals insight into EVD pathogenesis, suggests an effective approach for biomarker identification, and provides an important community resource for further analysis of human EVD severity.

Keywords: Ebola virus; biomarker; human; inflammation; neutrophils; omics; pancreatitis; pathogenesis; sepsis; systems biology.


Conflict of interest statement

The authors do not have any conflicts of interest to declare.

Figures

Figure 1
Figure 1. Study design and patient demographics
(A) Overview of blood sample collection from EVD patients and healthy controls. Serial samples from survivors are indicated by S1, S2, and S3. The number of days that elapsed between S1 and S2 or S2 and S3 collections is indicated at the bottom left. (B) The number of days between symptom onset and the first sample collection. (C) Statistical analysis of clinical and demographic data. Patient data are on the left (white background); and on the right (gray background), columns list chi-square (sex, disease presentation, and Ebola treatment center (ETC)) or t-test (age and time from symptom onset to first sample) results for comparisons between survivor (S) and fatality (F) or healthy control (H) patients. Odds ratios (OR) were estimated by logistic regression models with death as the outcome. For continuous parameters (age and time from symptom onset to first sample) the OR was estimated for a difference of 10 years (age) or 3 days (time from symptom onset to first sample). NA, not applicable. See also Figure S1 and Table S1.
Figure 2
Figure 2. EVD survivors and fatalities are differentiated by viral load and host responses
(A) EBOV load (copies per nanogram of input RNA) as determined by qRT-PCR of RNA from PBMCs. (B) Average cytokine levels (as determined by ELISAs) and associated P-values for EVD patients (fatalities, ‘F’; survivors’ first, second, and third samples, ‘S1’, ‘S2’, and ‘S3’) compared with healthy controls (H); or for S1/S2/S3 vs. F comparisons. Specific comparisons are represented in columns and assayed cytokines are represented in rows. For the expression heat map, F/S1/S2/S3 vs. H comparison values are displayed as the direction of expression in the EVD sample and S1/S2/S3 vs. F comparison values are displayed as the direction of expression in survivors. FC, fold change. (C) Expression trends for representative molecules from transcriptomics (P < 0.000001), proteomics (P < 0.001), metabolomics (P < 0.001), and lipidomics (P < 0.0001). Columns show log2 FC values for individual molecules (IDs not shown), and the color-coded bar above the heat map indicates the type of molecule in each column. Rows represent different comparison groups, and FC values are displayed as the direction of expression in the survivor samples versus the comparator. Lipid species identified by positive and negative ionization are shown separately. See also Figure S2 and Table S2.
Figure 3
Figure 3. EVD signatures in the plasma metabolome and lipidome
(A) Selected average plasma metabolite expression levels and associated P-values for EVD patients (data are represented in the same way as in Fig. 2B). FC, fold change. (B) The number of significantly changed (P < 0.01) plasma lipid species (from both positive and negative ionization analyses) that were increased (red line) or decreased (blue line) in EVD in at least one comparison (F vs. H, S1 vs. H, S2 vs. H, or S3 vs. H) for different lipid subclasses. The total number of significantly changed lipid species for each lipid subclass is shown by the dark gray line and is indicated in parentheses below each label at the edge of the radar map. The highest value depicted by the radar map is 30 (outermost concentric circle in light grey), and the line corresponding to 20 is labeled on the panel. Regardless of EVD outcome, lipid species in each subclass trended in the same direction. (C) The proportion of lipid species for each lipid subclass depicted in panel B that exhibit significantly higher (red line) or lower (blue line) expression in EVD fatalities relative to S1 (P < 0.01). The proportion of lipid species exhibiting no significant expression difference between EVD survivors (S1) and fatalities is also shown (green line). The highest value shown by the radar map is 100% (outermost concentric circle in light grey), and the line corresponding to 50% is labeled on the panel. CE, cholesterol ester; Cer, ceramide; HexCer, monohexosylceramide; GM3, ganglioside GM3; SM, sphingomyelin; DG, diacylglycerides; MG, monoacylglycerolipids; TG, triglycerides; PC, diacylglycerophosphocholine; LPC, monoacylglycerophosphocholine; PE, diacylglycerophosphoethanolamine; LPE, monoacylglycerophosphoethanolamine; PEP, PE plasmalogen; PG, diacylglycerophosphoglycerol; PI, diacylglycerophosphoinositol; PS, monoacylglycerophosphoserine. See also Table S2.
Figure 4
Figure 4. EVD signatures in the plasma proteome
Pathway enrichments and heat maps showing average pathway protein expression levels (log2 fold change, FC) and associated P-values for ‘Cell Adhesion Molecules’ (KEGG pathway hsa04514; panels (A) and (B)), and ‘Pancreatic Secretion’ (KEGG pathway hsa04972; panels (C) and (D)). (A and C) KEGG pathway enrichment scores as the negative log10 of the enrichment P-value for EVD patients (fatalities, ‘F’; survivors’ first, second, and third samples, ‘S1’, ‘S2’, and ‘S3’) compared with healthy controls (H); or for S1/S2/S3 vs. F comparisons. (B and D) Expression levels and associated P-values for a selected set of plasma proteins (indicated by Entrez Gene Official Symbols) included in the respective KEGG pathways (data are represented in the same way as in Fig. 2B). ‘NA’ in heat maps indicates that FC and P-values were not calculated due to an insufficient number of values in one of the conditions. In panel (B), ‘SELP/SELE’ indicates a protein profile that cannot be assigned to one of these proteins due to their high homology. See also Table S2 and Table S3.
Figure 5
Figure 5. EBOV infection strongly induces antiviral and anti-apoptotic gene expression in PBMCs
Shown are data associated with MEGENA Module 3, derived from PBMC transcriptome data. (A) Average PBMC expression levels and associated q-values for all transcripts exhibiting significantly altered expression (q-value < 0.01) in at least one condition when comparing EVD patients (fatalities, ‘F’; survivors’ first, second, and third samples, ‘S1’, ‘S2’, and ‘S3’) to healthy controls (H). For the transcriptome heat map, values are displayed as the direction of expression in the EVD patient. Columns show expression and q-values for individual transcripts (IDs not shown) and rows represent different comparison groups. FC, fold change. (B and C) Transcript level and q-value heat maps for a subset of Module 3 interferon-stimulated gene transcripts (B) and apoptosis-associated transcripts (C); data are represented in the same way as in Fig. 2B. Individual transcripts are represented as Entrez Gene Official Symbols. (D) Molecules involved in TNF receptor signaling leading to activation of inflammatory gene expression, apoptosis, and necroptosis, as well as those contributing to apoptosis though the mitochondrial pathway. Transcripts that are significantly altered in Module 3 (q-value < 0.05) are shown in red or blue text, indicating increased or decreased transcript expression in EVD, respectively. The TNF protein, which is elevated in the plasma of both EVD survivors and fatalities, is indicated by dark red text. Asterisks (*) indicate transcripts that were significantly changed only in EVD fatalities. See also Figure S3, Figure S4, Table S4, and Table S5.
Figure 6
Figure 6. Neutrophils may play a key role in EBOV pathogenicity
(A) Average PBMC transcript expression levels and associated q-values for all Module 18 transcripts that were significantly altered (q < 0.01) in at least one condition when comparing EVD patients with healthy controls (data are represented in the same way as in Fig. 5A). FC, fold change. (B–E) Average expression levels for individual transcripts in EVD vs. healthy control comparisons, with q-values indicated by the colored dots at the top of each bar. Panel (B) shows neutrophil markers from Module 18, panel (C) shows neutrophil activation and differentiation markers from Modules 18 and 27, panel (D) shows T lymphocyte markers from other modules, and panel (E) shows ARG1 expression from Module 27. (F) Normalized protein expression values for each sample from individual EVD patients or healthy controls. FC and P-values for the S1 vs. F comparison for MPO, CTSG and HIST3H2BB are shown below each plot; FC and P-values were not calculated for PRTN3 or AZU1 due to an insufficient number of samples in the S1 group. All transcript and protein IDs are given as Entrez Gene Official Symbols. See also Figure S3, Figure S5, Table S4, and Table S5.
Figure 7
Figure 7. Biomarkers that may predict outcomes of EVD
(A) Plots for 11 candidate biomarkers. Log2 normalized expression for each feature is plotted against the days from onset on which the corresponding sample was collected. Within each plot, each dot represents a single patient sample, colored by study group. Longitudinal samples from the same patient are connected with lines. Samples from healthy patients are shown together at the far right of each plot (indicated by an ‘H’ on the X-axis). Above each panel, the name of the candidate biomarker is given, along with the dataset from which it was derived. ‘lipid_neg’ and ‘lipid_pos’ indicate lipids identified by negative ionization or positive ionization LC-MS/MS, respectively. ‘_A’ or ‘_B’ designations indicate that the lipid has an isomer that differs only in structural arrangement. Cytokine (IL6 and TNF) data are derived from plasma ELISA analysis. (B) Patient sample scores from probabilistic principal components analysis using the 11 candidate biomarkers shown in panel (A). Samples assessed in this analysis were not included in the biomarker prediction analysis pipeline due to missing data. Each dot represents an individual patient sample. See also Figure S7 and Table S6.

Similar articles

Cited by

References

    1. Agarwal N, Pitchumoni CS. Acute pancreatitis: a multisystem disease. Gastroenterologist. 1993;1:115–128. - PubMed
    1. Blow JA, Dohm DJ, Negley DL, Mores CN. Virus inactivation by nucleic acid extraction reagents. J Virol Methods. 2004;119:195–198. - PubMed
    1. Carmona-Rivera C, Kaplan MJ. Low-density granulocytes: a distinct class of neutrophils in systemic autoimmunity. Semin Immunopathol. 2013;35:455–463. - PMC - PubMed
    1. Darcy CJ, Minigo G, Piera KA, Davis JS, McNeil YR, Chen Y, Volkheimer AD, Weinberg JB, Anstey NM, Woodberry T. Neutrophils with myeloid derived suppressor function deplete arginine and constrain T cell function in septic shock patients. Crit Care. 2014;18:R163. - PMC - PubMed
    1. Etzerodt A, Moestrup SK. CD163 and inflammation: biological, diagnostic, and therapeutic aspects. Antioxid Redox Signal. 2013;18:2352–2363. - PMC - PubMed

MeSH terms