. 2018 Jan 2;217(1):251-268.
doi: 10.1083/jcb.201709111. Epub 2017 Nov 15.

INF2-mediated actin polymerization at the ER stimulates mitochondrial calcium uptake, inner membrane constriction, and division

Affiliations

INF2-mediated actin polymerization at the ER stimulates mitochondrial calcium uptake, inner membrane constriction, and division

Rajarshi Chakrabarti et al. J Cell Biol. .

Abstract

Mitochondrial division requires division of both the inner and outer mitochondrial membranes (IMM and OMM, respectively). Interaction with endoplasmic reticulum (ER) promotes OMM division by recruitment of the dynamin Drp1, but effects on IMM division are not well characterized. We previously showed that actin polymerization through ER-bound inverted formin 2 (INF2) stimulates Drp1 recruitment in mammalian cells. Here, we show that INF2-mediated actin polymerization stimulates a second mitochondrial response independent of Drp1: a rise in mitochondrial matrix calcium through the mitochondrial calcium uniporter. ER stores supply the increased mitochondrial calcium, and the role of actin is to increase ER-mitochondria contact. Myosin IIA is also required for this mitochondrial calcium increase. Elevated mitochondrial calcium in turn activates IMM constriction in a Drp1-independent manner. IMM constriction requires electron transport chain activity. IMM division precedes OMM division. These results demonstrate that actin polymerization independently stimulates the dynamics of both membranes during mitochondrial division: IMM through increased matrix calcium, and OMM through Drp1 recruitment.


Figures

Figure 1.
Figure 1.
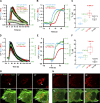
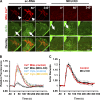
The stimulus-induced actin burst precedes the mitochondrial calcium spike. (A and D) Quantification of cytoplasmic calcium (Cyto-R-GECO), cytoplasmic actin (GFP-Ftractin), or mitochondrial calcium (Mito-R-GECO) in U2OS cells after 4 µM ionomycin (A) or 100 µM histamine (D) stimulation. Rapid acquisition mode (4.8 frames/s). Values on the y axis represent the value at time X normalized to the value at time 0 (F/F0); n = 10–16 cells (also given in C). Error bars represent SEM. Corresponds to Videos 1 and 2. (B and E) Zoom of early time points from graphs in A (ionomycin) and D (histamine) showing the distinct kinetics of cytoplasmic calcium, actin, and mitochondrial calcium. Error bars have been removed for clarity. (C and F) Box-and-whiskers plots of stimulation half-times based on the curves in A and D. Number of cells for each reading is 14 (cytoplasmic calcium, ionomycin), 10 (actin, ionomycin), 14 (mitochondrial calcium, ionomycin), 12 (ER calcium, ionomycin), 14 (cytoplasmic calcium, histamine), 11 (actin, histamine), 16 (mitochondrial calcium, histamine), and 10 (ER calcium, histamine). Each point represents one cell. Error bars represent SD (G and H) Time-lapse montages of actin (green, GFP-Ftractin) and mitochondrial calcium (red, mito-R-GECO) changes in the same cell after 4 µM ionomycin (G) or 100 µM histamine (H) stimulation. Mitochondrial calcium alone shown in the top panels and merge in the bottom panels; taken at one frame per 1.03 s (G) and 1.2 s (H). Arrows in the merged panel indicate regions of the cytoplasm displaying the cytoplasmic actin burst. Bars: (G) 5 µm; (H) 10 µm. Corresponds to Videos 3 and 4.
Figure 2.
Figure 2.
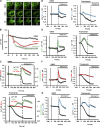
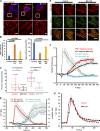
Calcium release from the ER triggered by ionomycin and histamine. (A) Time-lapse montages of U2OS cells transfected with the ER calcium probe (ER-GCaMP6-150) and treated with DMSO (top), 4 µM ionomycin (middle), or 100 µM histamine (bottom). Time in seconds. Bar, 10 µm. Corresponds to Video 5. (B) Graph quantifying changes in ER calcium upon the treatments described in A; n = 12, 15, and 15 cells for DMSO, ionomycin, and histamine, respectively. Error bars represent SEM. (C) Effect of thapsigargin on ER calcium (black curves), actin burst (green curves), and mitochondrial calcium (red curves) before and after ionomycin stimulation. U2OS cells transfected with ER calcium probe and mApple-Ftractin. DMSO (top graph) or 1 µM thapsigargin (bottom graph) was applied at 0 s (bold line) and 4 µM ionomycin was applied at the time indicated by the dashed line; n = 10 cells (DMSO) or 13 cells (thapsigargin). Error bars represent SEM. (D) Effect of thapsigargin on histamine-induced cytoplasmic calcium and ER calcium changes. U2OS cells transfected with ER calcium probe and Cyto-R-GECO; n = 15 cells (DMSO) or 15 cells (thapsigargin). (E) Effect of thapsigargin on histamine-induced actin burst and ER calcium. U2OS cells were transfected with ER calcium probe and mApple-Ftractin; n = 10 cells (DMSO) or 11 cells (thapsigargin). Error bars represent SEM. (F) Effect of thapsigargin on histamine-induced mitochondrial calcium and ER calcium. U2OS cells transfected with ER calcium probe and mito-R-GECO; n = 12 cells (DMSO) or 14 cells (Thapsigargin). Error bars represent SEM. (G) Effect of thapsigargin on ionomycin-induced cytoplasmic calcium and ER calcium. U2OS cells transfected with both the Cyto-R-Geco and ER-GCaMP6-150; n = 17 cells (DMSO) or 16 cells (thapsigargin). Error bars represent SEM.
Figure 3.
Figure 3.
Actin requirement for stimulus-induced mitochondrial calcium spike. (A and B) Effect of 2 μM LatA treatment on ionomycin-induced (A) or histamine-induced (B) actin polymerization burst and mitochondrial calcium spike in U2OS cells; n = 10–15 cells. Error bars represent SEM. (C and D) Mitochondrial calcium spike after ionomycin (C) or histamine (D) stimulus in U2OS-WT, U2OS-INF2-KO, or INF2-KO cells reexpressing GFP-INF2-CAAX or GFP-INF2-nonCAAX. Control U2OS-INF2-KO cells are expressing GFP-Sec61β as an ER marker instead of INF2. Error bars represent SEM. (E) Actin polymerization burst after ionomycin stimulation in U2OS-WT and U2OS-INF2-KO cells. Rescue by transfection of GFP-INF2-CAAX or GFP-INF2-nonCAAX is also shown; n = 15–18 cells. Error bars represent SEM. (F) Ionomycin-induced actin morphology in INF2-KO cells reexpressing GFP-INF2-CAAX or GFP-INF2-nonCAAX. Whole-cell view shown prestimulation. Insets shown prestimulation (0”, left) and after 30 s stimulation (30”, right). Taken in a single confocal plane in an apical region of the cell body, which reduces actin background from stress fibers but causes the ER to appear fragmented. Arrows show examples of actin filament accumulation. Bars: (main) 5 µm; (inset) 2 µm. Corresponds to Video 6.
Figure 4.
Figure 4.
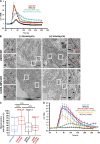
INF2-mediated actin polymerization is required for stimulation of ER–mitochondrial contact. (A) Change in calcium levels at the cytoplasmic face of the OMM upon 4 µM ionomycin stimulation in U2OS-WT and INF2-KO cells. Cells were transfected with the Mass70-LAR-GECO1.2 construct, a low-affinity calcium probe (Kd of 12 µM) tethered to the cytoplasmic face of the OMM. For rescue, INF2-KO cells were transfected with plasmid expressing GFP-INF2-CAAX or GFP-INF2-nonCAAX. Ionomycin was added at 0 s in n = 24 cells (WT), 19 cells (INF2-KO), 22 cells (INF2-CAAX), and 16 cells (INF2-non CAAX). Error bars represent SEM. (B) Electron micrographs showing examples of the relationship between the ER and mitochondria in WT cells (top images) and INF2-KO cells (bottom images) in either the unstimulated condition [(−) ionomycin, left images] or after 60 s stimulation with 4 µM ionomycin [(+) ionomycin, right images]. Two zooms shown for each panel (regions indicated by numbered arrows on the main panels). Examples of ER–mitochondrial contacts of <30 nm are indicated by red arrows, whereas examples of more distant contacts indicated by black arrows. Bars: (main micrographs) 500 nm; (zooms) 100 nm. (C) Quantification from electron micrographs of the percentage of mitochondria with close ER contacts in WT cells (n = 244 mitochondria), WT cells stimulated with ionomycin (n = 176 mitochondria), INF2-KO cells (n = 245 mitochondria), and INF2-KO cells stimulated with ionomycin (n = 204 mitochondria). Values represent mean ± SEM; ***, P < 0.001 (unpaired Student’s t test). Each point represents one imaged field. (D) Rescue of mitochondrial calcium response in INF2-KO cells by overexpression of ER–mitochondrial tethers. INF2-KO U2OS cells were transfected with a mitochondrial matrix calcium probe (Mito-R-GECO) along with either CFP-VAPB or GFP-PTPIP51 and then stimulated with 4 µM ionomycin. The effects of either GFP-INF2-CAAX or GFP-INF2-nonCAAX reexpression are shown for comparison; n = 10 cells (WT), 8 cells (INF2-KO), 11 cells (INF2 non-CAAX), 15 cells (INF2-CAAX), 10 cells (PTPIP51), or 14 cells (VAPB). Error bars represent SEM.
Figure 5.
Figure 5.
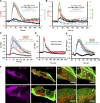
MCU suppression inhibits the mitochondrial calcium spike without inhibiting the actin burst. U2OS cells were transfected with either scrambled siRNA (control) or siRNA against MCU (MCU KD). After 48 h, cells were transfected with mito-R-GECO (mitochondrial calcium) and GFP-Ftractin (polymerized actin) or cyto-R-GECO (cytoplasmic calcium) and imaged at 72 h after siRNA treatment. (A) Confocal image montages of cells at indicated times after 4 µM ionomycin stimulation. For MCU KD, the mitochondrial calcium signal is enhanced to reveal the faint mitochondrial outline. Arrowheads show mitochondrial calcium rise, and arrows denote polymerized actin increases. Bars, 5 µm. (B) Quantification of the mitochondrial and cytosolic calcium spikes upon stimulation with 4 µM ionomycin (at time 0); n = 10 cells (Mito calcium control), 18 cells (Mito calcium MCU KD), 10 cells (Cyto calcium control), or 15 cells (Cyto calcium MCU KD). Error bars represent SEM. (C) Quantification of the actin burst upon stimulation with 4 µM ionomycin (at time 0); n = 10 cells (control) or 15 cells (MCU KD). Error bars represent SEM.
Figure 6.
Figure 6.
MCU suppression inhibits mitochondrial division, but not Drp1 oligomerization. (A) U2OS cells were transfected with scrambled siRNA (control), MCU siRNA (MCU KD), and Drp1 siRNA (Drp1 KD) for 72 h Cells were then fixed and mitochondria stained using anti-Tom20 (red) and DAPI (blue). ROIs of fixed dimension were analyzed for mitochondrial length and number as described in Materials and methods. Images of control (left), Drp1 KD (middle), or MCU KD cells (right) are shown. Bars: (main) 5 µm; (insets) 2 µm. (B) Mean mitochondrial length quantification represented as area (square micrometers) per mitochondrion (left) and mean mitochondrial number quantification (right) for 80, 53, and 50 cells for control, MCU KD, and Drp1 KD cells, respectively. Errors bars represent SEM. P-values were obtained from an unpaired Student’s t test. (C) Quantification of mitochondrial division rate in control and MCU KD U2OS cells by measuring the number of division events in peripheral ROIs from live-cell videos of mitochondrial matrix marker (mito-BFP), either in unstimulated cells or cells in the first 10 min of 4 µM ionomycin stimulation; n = 19 cells [control (−) ionomycin], 21 cells [control (+) ionomycin], 20 cells [MCU KD (−) ionomycin], or 22 cells [MCU KD (+) ionomycin]. Each point represents one ROI per cell. P-values were obtained from an unpaired Student’s t test. *, P < 0.015; ***, P < 0.0001. Error bars represent SD. (D) Quantification of mitochondrially associated Drp1 oligomers and mitochondrial calcium in response to 4 µM ionomycin. GFP-Drp1 knock-in cells were treated with scrambled siRNA or MCU siRNA for 48 h and then transfected with mito-R-GECO and mito-BFP. Cells were imaged at 72 h after siRNA treatment; n = 20 cells in each case. Ionomycin addition at 0 s. Error bars represent SEM. (E) Micrographs from GFP-Drp1 knock-in U2OS cells (control and MCU siRNA treated) transfected with mito-BFP (red) and treated with 4 µM ionomycin as in B. Prestimulation (0”) and 300-s stimulations are shown. Bar, 10 µm. (F) Drp1 oligomerization kinetics in MCU KD cells, as measured in the whole cell. GFP-Drp1 knock-in U2OS cells were treated with control siRNA or MCU siRNA for 72 h and then stimulated with 4 µM ionomycin while acquiring GFP images. The amount of oligomerized Drp1 was assessed as GFP signal above the cytoplasmic background signal, as described in Materials and methods; n = 20 cells in each case. Error bars represent SEM. (G) Quantification of mitochondrial calcium increase in control or Drp1 KD U2OS cells upon 4 µM ionomycin stimulation; n = 14 cells in each case. Error bars represent SEM.
Figure 7.
Figure 7.
Mitochondrial constrictions are MCU dependent and Drp1 independent. (A) Quantification of mitochondrial constriction frequency in the unstimulated (blue) or ionomycin-stimulated (red) conditions, represented as constrictions per mm mitochondrial length in U2OS-control, Drp1-KD, and MCU-KD cells. P-values were obtained from an unpaired Student’s t test. Error bars represent SEM. Control:, 16 ROI, 2,508 µm mitochondrial length; Drp1 KD, 10 ROI, 1,000 µm; MCU KD: 20 ROI, 2,600 µm. (B) Representative confocal montages of control, Drp1-KD, and MCU-KD U2OS cells transfected with mito-R-GECO (mitochondrial calcium, red) and mitoBFP (mitochondrial matrix, blue) and then treated with 4 µM ionomycin at time 0. Time in seconds. White arrows point to constrictions and yellow arrows to fission events. Bar, 5 µm. Corresponds to Video 8. (C) U2OS cell transfected with GFP-Sec61β (green, ER marker) and mito-R-GECO (red, mitochondrial calcium) and imaged live before ionomycin stimulation (top) and at 35 s after 4 µM ionomycin addition (bottom). Image on the right is an expanded view of the (+) ionomycin condition. Bars: (regular panels) 2 µm; (expanded panel) 1 µm. Arrows denote ER presence at mitochondrial constrictions. Corresponds to Video 9. (D) Quantification of percent mitochondrial constrictions corresponding to ER contact from live-cell confocal microscopy of ionomycin-stimulated cells such as in C and Video 9. 204 constrictions from 26 ROIs from 13 cells assessed, totaling a 461-µm2 mitochondrial area.
Figure 8.
Figure 8.
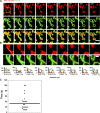
IMM division before OMM division during mitochondrial division. (A) U2OS cells transfected with mito-R-GECO (mitochondrial matrix calcium, red) and GFP-Tom20 (OMM, green) were imaged live by Airyscan microscopy at 9-s intervals after 4 µM ionomycin treatment. Representative time-lapse montage of a mitochondrial division event shown here. Bar, 2 µm. (B) Zoom of the division site (boxed in A). The mito-R-GECO levels have been enhanced to detect the existence of any thin matrix tether. Line scans indicate that the OMM tether persists in the absence of a matrix tether. Bar, 500 nm. (C) Quantification of time between apparent matrix separation and apparent OMM separation in mitochondrial division events after CGP37157 stimulation (example in Fig. S4 E). 29 division events from 23 cells. Mean time, 32.3 ± 29.1 s (SD). Each point represents one division event.
Figure 9.
Figure 9.
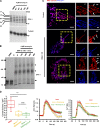
IMM constrictions do not require Oma1 activity but do require the ETC. (A) Western blot of Opa1 isoform pattern in U2OS cells during 4 µM ionomycin stimulation during the period of optimum calcium-induced constrictions. Mass is in kilodaltons. L1, L2, and S3–5 refer to Opa1 isoforms are as defined previously (Anand et al., 2014; Otera et al., 2016). (B) Western blot of Opa1 after live-cell cross-linking with BMH to reveal Opa1 oligomerization changes during 4 µM ionomycin stimulation. Oligomers are labeled with arrowheads and monomers with an arrow. Mass is in kilodaltons. (C) Constrictions in U2OS cells that had been transfected with Oma1 siRNA for 72 h, followed by transfection of mito-R-GECO and mitoBFP for 24 h and stimulation by 4 µM ionomycin for 60 s. Bars: (main) 5 µm; (insets) 2 µm. (D) Effect of 5 µM antimycin A or 2.5 µM rotenone on (left to right) mitochondrial constrictions, actin burst, and mitochondrial calcium spike induced by 4 µM ionomycin. Antimycin A or rotenone was added simultaneously to ionomycin. For mitochondrial constriction assessment: n = 10 ROIs, 200 µm2 mitochondrial area (Iono), 11 ROIs, 136 µm2 (Iono + rotenone); and 16 ROIs, 300 µm2 (Iono + Antimycin A). For actin filament assessment, 10 cells were used for each condition. For mitochondrial calcium assessment, 15–20 cells were used for each condition. P-values are from an unpaired Student’s t test. ***, P < 0.0011. Error bars represent SD (constriction quantification) or SEM (actin filament and mitochondrial calcium assessment).

Comment in

Similar articles

Cited by

References

    1. Abramov A.Y., and Duchen M.R.. 2003. Actions of ionomycin, 4-BrA23187 and a novel electrogenic Ca2+ ionophore on mitochondria in intact cells. Cell Calcium. 33:101–112. 10.1016/S0143-4160(02)00203-8 - DOI - PubMed
    1. Anand R., Wai T., Baker M.J., Kladt N., Schauss A.C., Rugarli E., and Langer T.. 2014. The i-AAA protease YME1L and OMA1 cleave OPA1 to balance mitochondrial fusion and fission. J. Cell Biol. 204:919–929. 10.1083/jcb.201308006 - DOI - PMC - PubMed
    1. Baffy G., Miyashita T., Williamson J.R., and Reed J.C.. 1993. Apoptosis induced by withdrawal of interleukin-3 (IL-3) from an IL-3-dependent hematopoietic cell line is associated with repartitioning of intracellular calcium and is blocked by enforced Bcl-2 oncoprotein production. J. Biol. Chem. 268:6511–6519. - PubMed
    1. Baughman J.M., Perocchi F., Girgis H.S., Plovanich M., Belcher-Timme C.A., Sancak Y., Bao X.R., Strittmatter L., Goldberger O., Bogorad R.L., et al. . 2011. Integrative genomics identifies MCU as an essential component of the mitochondrial calcium uniporter. Nature. 476:341–345. 10.1038/nature10234 - DOI - PMC - PubMed
    1. Bennett D.L., Cheek T.R., Berridge M.J., De Smedt H., Parys J.B., Missiaen L., and Bootman M.D.. 1996. Expression and function of ryanodine receptors in nonexcitable cells. J. Biol. Chem. 271:6356–6362. 10.1074/jbc.271.11.6356 - DOI - PubMed

Publication types

MeSH terms