Estrogen and high-fat diet induced alterations in C57BL/6 mice endometrial transcriptome profile
- PMID: 29133384
- PMCID: PMC5744625
- DOI: 10.1530/EC-17-0315
Estrogen and high-fat diet induced alterations in C57BL/6 mice endometrial transcriptome profile
Abstract
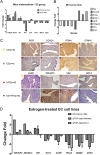
Unopposed estrogen stimulation and insulin resistance are known to play important roles in endometrial cancer (EC), but the interaction between these two factors and how they contribute to endometrial lesions are not completely elucidated. To investigate the endometrial transcriptome profile and the associated molecular pathway alterations, we established an ovariectomized C57BL/6 mouse model treated with subcutaneous implantation of 17-β estradiol (E2) pellet and/or high-fat diet (HFD) for 12 weeks to mimic sustained estrogen stimulation and insulin resistance. Histomorphologically, we found that both E2 and E2 + HFD groups showed markedly enlarged uterus and increased number of endometrial glands. The endometrium samples were collected for microarray assay. GO and KEGG analysis showed that genes regulated by E2 and/or HFD are mainly responsible for immune response, inflammatory response and metabolic pathways. Further IPA analysis demonstrated that the acute phase response signaling, NF-κB signaling, leukocyte extravasation signaling, PPAR signaling and LXR/RXR activation pathways are mainly involved in the pathways above. In addition, the genes modulated reciprocally by E2 and/or HFD were also analyzed, and their crosstalk mainly focuses on enhancing one another's activity. The combination analysis of microarray data and TCGA database provided potential diagnostic or therapeutic targets for EC. Further validation was performed in mice endometrium and human EC cell lines. In conclusion, this study unraveled the endometrial transcriptome profile alterations affected by E2 and/or HFD that may disturb endometrial homeostasis and contribute to the development of endometrial hyperplasia.
Keywords: 17-β estradiol; C57BL/6 mice; endometrial cancer; high-fat diet; microarray.
© 2018 The authors.
Figures


Similar articles
-
Effect of High-fat Diet-induced Disorders on Rat with Endometrial Hyperplasia and Adiponectin System in Circulation and Uterus.Chin Med J (Engl). 2017 Aug 5;130(15):1831-1837. doi: 10.4103/0366-6999.211551. Chin Med J (Engl). 2017. PMID: 28748857 Free PMC article.
-
Estrogens protect against high-fat diet-induced insulin resistance and glucose intolerance in mice.Endocrinology. 2009 May;150(5):2109-17. doi: 10.1210/en.2008-0971. Epub 2009 Jan 22. Endocrinology. 2009. PMID: 19164473
-
Crosstalk between estrogen receptor and mitogen-activated protein kinase signaling in the development and progression of endometrial cancer.Int J Gynecol Cancer. 2011 Nov;21(8):1357-65. doi: 10.1097/IGC.0b013e3182216ac9. Int J Gynecol Cancer. 2011. PMID: 21720253
-
Molecular adaptations underlying the beneficial effects of hydroxytyrosol in the pathogenic alterations induced by a high-fat diet in mouse liver: PPAR-α and Nrf2 activation, and NF-κB down-regulation.Food Funct. 2017 Apr 19;8(4):1526-1537. doi: 10.1039/c7fo00090a. Food Funct. 2017. PMID: 28386616
-
Activation of Estrogen Response Element-Independent ERα Signaling Protects Female Mice From Diet-Induced Obesity.Endocrinology. 2017 Feb 1;158(2):319-334. doi: 10.1210/en.2016-1535. Endocrinology. 2017. PMID: 27901601 Free PMC article.
Cited by
-
Comparative transcriptome analysis between patient and endometrial cancer cell lines to determine common signaling pathways and markers linked to cancer progression.Oncotarget. 2021 Dec 21;12(26):2500-2513. doi: 10.18632/oncotarget.28161. eCollection 2021 Dec 21. Oncotarget. 2021. PMID: 34966482 Free PMC article.
-
The Role of Metabolic Syndrome in Endometrial Cancer: A Review.Front Oncol. 2019 Aug 8;9:744. doi: 10.3389/fonc.2019.00744. eCollection 2019. Front Oncol. 2019. PMID: 31440472 Free PMC article. Review.
-
Dynamic Alteration of the Gut Microbiota Associated with Obesity and Intestinal Inflammation in Ovariectomy C57BL/6 Mice.Int J Endocrinol. 2022 Jan 22;2022:6600158. doi: 10.1155/2022/6600158. eCollection 2022. Int J Endocrinol. 2022. PMID: 35103060 Free PMC article.
-
Regulated expression of Gemin5, Xrn1, Cpeb and Stau1 in the uterus and ovaries after superovulation and the effect of exogenous estradiol and leptin in rodents.Mol Biol Rep. 2019 Apr;46(2):2533-2540. doi: 10.1007/s11033-019-04606-z. Epub 2019 Jan 28. Mol Biol Rep. 2019. PMID: 30689188
-
Sexual dimorphic metabolic and cognitive responses of C57BL/6 mice to Fisetin or Dasatinib and quercetin cocktail oral treatment.Geroscience. 2023 Oct;45(5):2835-2850. doi: 10.1007/s11357-023-00843-0. Epub 2023 Jun 9. Geroscience. 2023. PMID: 37296266 Free PMC article.
References
-
- Kaaks R, Lukanova A, Kurzer MS. Obesity, endogenous hormones, and endometrial cancer risk: a synthetic review. Cancer Epidemiology, Biomarkers and Prevention 2002. 11 1531–1543. - PubMed
-
- Berstein LM, Kvatchevskaya JO, Poroshina TE, Kovalenko IG, Tsyrlina EV, Zimarina TS, Ourmantcheeva AF, Ashrafian L, Thijssen JH. Insulin resistance, its consequences for the clinical course of the disease, and possibilities of correction in endometrial cancer. Journal of Cancer Research and Clinical Oncology 2004. 130 687–693. (10.1007/s00432-004-0587-2) - DOI - PubMed
-
- Burzawa JK, Schmeler KM, Soliman PT, Meyer LA, Bevers MW, Pustilnik TL, Anderson ML, Ramondetta LM, Tortolero-Luna G, Urbauer DL, et al. Prospective evaluation of insulin resistance among endometrial cancer patients. American Journal of Obstetrics and Gynecology 2011. 204 355.e1–357.e1. (10.1016/j.ajog.2010.11.033) - DOI - PMC - PubMed
LinkOut - more resources
Full Text Sources
Other Literature Sources
Molecular Biology Databases

