

Differential cell-matrix mechanoadaptations and inflammation drive regional propensities to aortic fibrosis, aneurysm or dissection in hypertension
- PMID: 29118111
- PMCID: PMC5721146
- DOI: 10.1098/rsif.2017.0327
Differential cell-matrix mechanoadaptations and inflammation drive regional propensities to aortic fibrosis, aneurysm or dissection in hypertension
Abstract
The embryonic lineage of intramural cells, microstructural organization of the extracellular matrix, local luminal and wall geometry, and haemodynamic loads vary along the length of the aorta. Yet, it remains unclear why certain diseases manifest differentially along the aorta. Toward this end, myriad animal models provide insight into diverse disease conditions-including fibrosis, aneurysm and dissection-but inherent differences across models impede general interpretations. We examined region-specific cellular, matrix, and biomechanical changes in a single experimental model of hypertension and atherosclerosis, which commonly coexist. Our findings suggest that (i) intramural cells within the ascending aorta are unable to maintain the intrinsic material stiffness of the wall, which ultimately drives aneurysmal dilatation, (ii) a mechanical stress-initiated, inflammation-driven remodelling within the descending aorta results in excessive fibrosis, and (iii) a transient loss of adventitial collagen within the suprarenal aorta contributes to dissection propensity. Smooth muscle contractility helps to control wall stress in the infrarenal aorta, which maintains mechanical properties near homeostatic levels despite elevated blood pressure. This early mechanoadaptation of the infrarenal aorta does not preclude subsequent acceleration of neointimal formation, however. Because region-specific conditions may be interdependent, as, for example, diffuse central arterial stiffening can increase cyclic haemodynamic loads on an aneurysm that is developing proximally, there is a clear need for more systematic assessments of aortic disease progression, not simply a singular focus on a particular region or condition.
Keywords: angiotensin II; aortic stiffness; inflammatory cells; smooth muscle; stress.
© 2017 The Author(s).
Conflict of interest statement
We declare no competing interests.
Figures
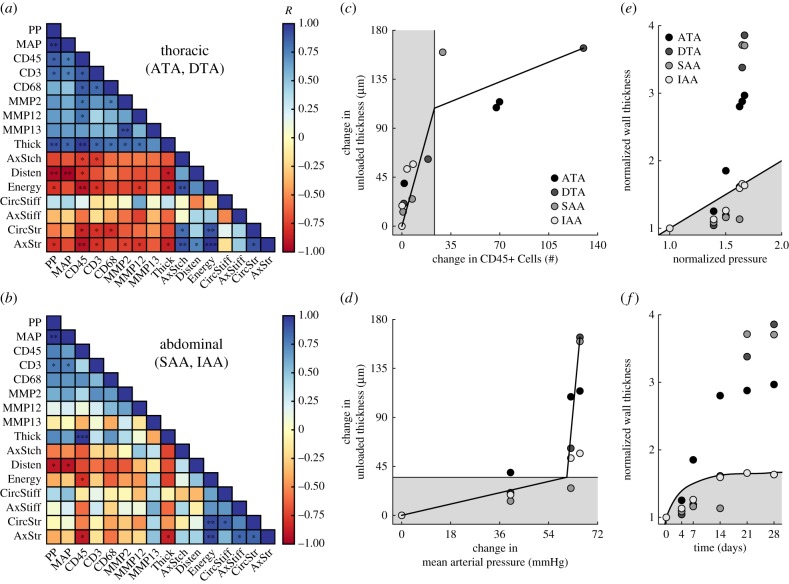
 [21]. The time course of thickness adaptation should, therefore, mimic the nearly logarithmic behaviour of the pressure increase (cf. electronic supplementary material, figure S1). (e) Pressure- and (f) time-dependent thickness adaptation was achieved by the IAA alone (light grey circles). Data off the line of identity (black line in e), or the line of adaptation (black curve in f), indicate areas of either progressively adaptive (
 ; grey) or maladaptive (
 ; white) remodelling. Statistical significance (in a and b) is denoted by *, **, ***p < 0.05, 0.01, 0.001. All correlation coefficients and p-values are in electronic supplementary material, tables S6A–N.
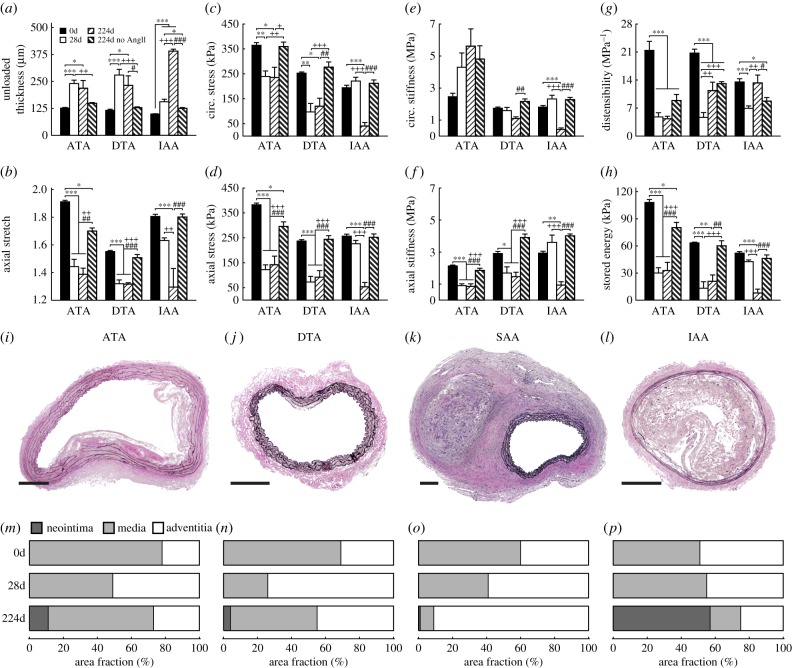
Similar articles
-
Role of Macrophage Socs3 in the Pathogenesis of Aortic Dissection.J Am Heart Assoc. 2018 Jan 17;7(2):e007389. doi: 10.1161/JAHA.117.007389. J Am Heart Assoc. 2018. PMID: 29343476 Free PMC article.
-
Aortic Aneurysms and Dissections Series.Arterioscler Thromb Vasc Biol. 2020 Mar;40(3):e37-e46. doi: 10.1161/ATVBAHA.120.313991. Epub 2020 Feb 26. Arterioscler Thromb Vasc Biol. 2020. PMID: 32101472 Free PMC article. Review.
-
Pharmacologically Improved Contractility Protects Against Aortic Dissection in Mice With Disrupted Transforming Growth Factor-β Signaling Despite Compromised Extracellular Matrix Properties.Arterioscler Thromb Vasc Biol. 2016 May;36(5):919-27. doi: 10.1161/ATVBAHA.116.307436. Epub 2016 Mar 17. Arterioscler Thromb Vasc Biol. 2016. PMID: 26988590 Free PMC article.
-
Thrombospondin-4 mediates cardiovascular remodelling in angiotensin II-induced hypertension.Cardiovasc Pathol. 2018 Jul-Aug;35:12-19. doi: 10.1016/j.carpath.2018.03.003. Epub 2018 Apr 7. Cardiovasc Pathol. 2018. PMID: 29729633
-
Biology of aortic aneurysms and dissections.Methodist Debakey Cardiovasc J. 2011 Jul-Sep;7(3):2-7. doi: 10.14797/mdcj-7-3-2. Methodist Debakey Cardiovasc J. 2011. PMID: 21979117 Review.
Cited by
-
Compromised Cardiopulmonary Function in Fibulin-5 Deficient Mice.J Biomech Eng. 2022 Aug 1;144(8):081008. doi: 10.1115/1.4053873. J Biomech Eng. 2022. PMID: 35171214 Free PMC article.
-
mTOR inhibition prevents angiotensin II-induced aortic rupture and pseudoaneurysm but promotes dissection in Apoe-deficient mice.JCI Insight. 2022 Feb 8;7(3):e155815. doi: 10.1172/jci.insight.155815. JCI Insight. 2022. PMID: 35132962 Free PMC article.
-
Biodegradable external wrapping promotes favorable adaptation in an ovine vein graft model.Acta Biomater. 2022 Oct 1;151:414-425. doi: 10.1016/j.actbio.2022.08.029. Epub 2022 Aug 20. Acta Biomater. 2022. PMID: 35995404 Free PMC article.
-
Plasticity of cerebral microvascular structure and mechanics during hypertension and following recovery of arterial pressure.Am J Physiol Heart Circ Physiol. 2022 Dec 1;323(6):H1108-H1117. doi: 10.1152/ajpheart.00292.2022. Epub 2022 Oct 21. Am J Physiol Heart Circ Physiol. 2022. PMID: 36269650 Free PMC article.
-
Persistent non-homeostatic remodeling of aortic collagen following a brief episode of hypertension: A computational study.J Mech Behav Biomed Mater. 2023 Aug;144:105966. doi: 10.1016/j.jmbbm.2023.105966. Epub 2023 Jun 7. J Mech Behav Biomed Mater. 2023. PMID: 37327590 Free PMC article.
References
Publication types
MeSH terms
Grants and funding
LinkOut - more resources
Full Text Sources
Other Literature Sources
Medical
