. 2017 Oct 31;8(1):1214.
doi: 10.1038/s41467-017-01150-x.

Earliest accumulation of β-amyloid occurs within the default-mode network and concurrently affects brain connectivity

Affiliations

Earliest accumulation of β-amyloid occurs within the default-mode network and concurrently affects brain connectivity

Sebastian Palmqvist et al. Nat Commun. .

Abstract

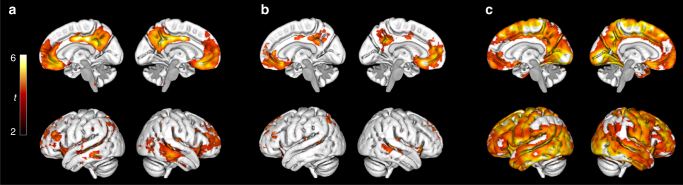
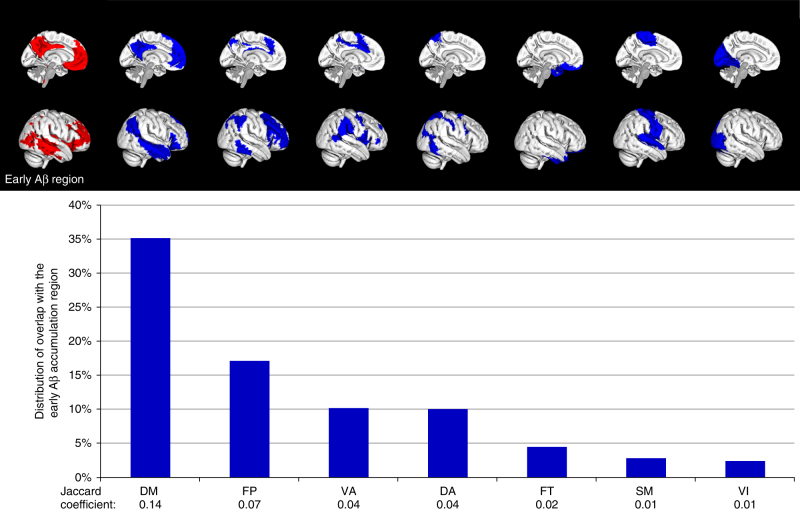
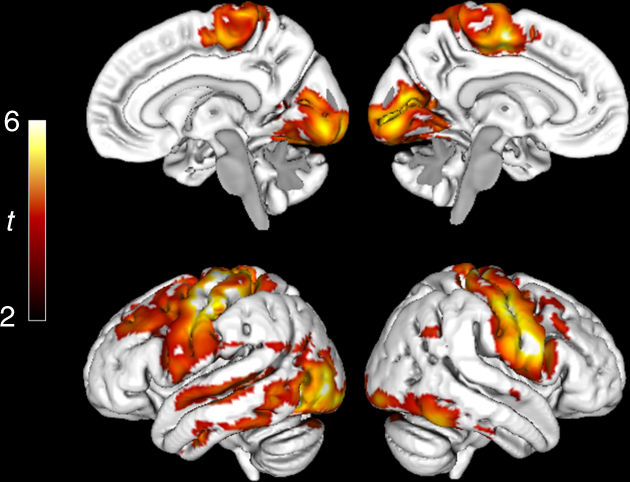
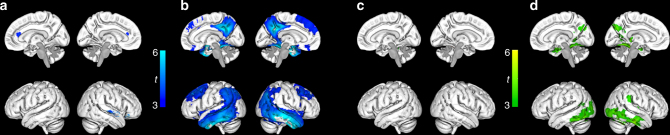
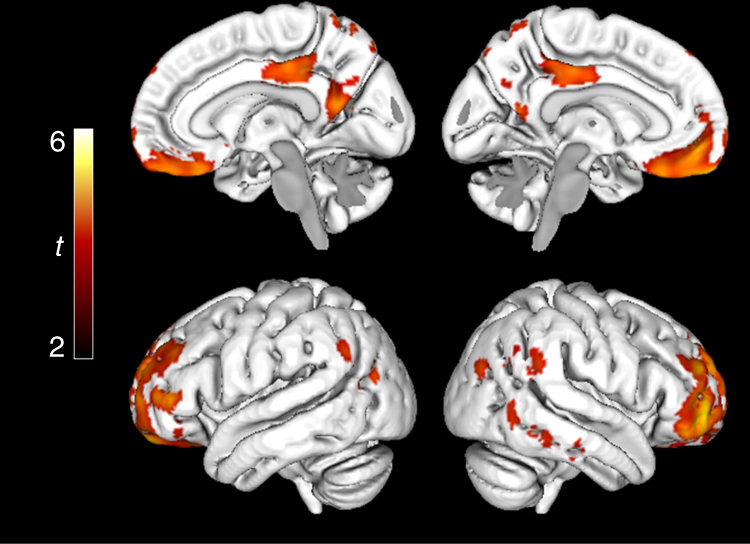
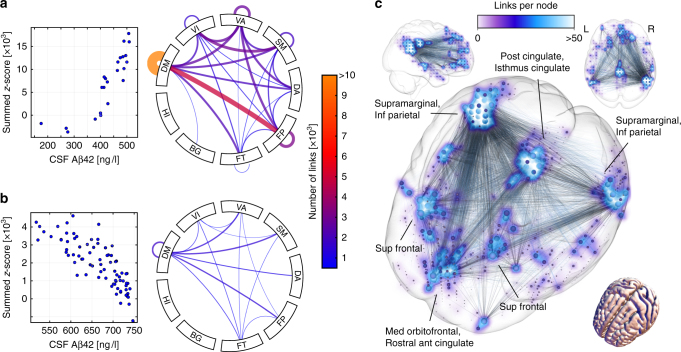
It is not known exactly where amyloid-β (Aβ) fibrils begin to accumulate in individuals with Alzheimer's disease (AD). Recently, we showed that abnormal levels of Aβ42 in cerebrospinal fluid (CSF) can be detected before abnormal amyloid can be detected using PET in individuals with preclinical AD. Using these approaches, here we identify the earliest preclinical AD stage in subjects from the ADNI and BioFINDER cohorts. We show that Aβ accumulation preferentially starts in the precuneus, medial orbitofrontal, and posterior cingulate cortices, i.e., several of the core regions of the default mode network (DMN). This early pattern of Aβ accumulation is already evident in individuals with normal Aβ42 in the CSF and normal amyloid PET who subsequently convert to having abnormal CSF Aβ42. The earliest Aβ accumulation is further associated with hypoconnectivity within the DMN and between the DMN and the frontoparietal network, but not with brain atrophy or glucose hypometabolism. Our results suggest that Aβ fibrils start to accumulate predominantly within certain parts of the DMN in preclinical AD and already then affect brain connectivity.


Conflict of interest statement

S.P., M.S., O.S., N.M., and E.S. report no competing financial interests. K.B. has served as a consultant or at advisory boards for Alzheon, Eli Lilly, Fujirebio Europe, I.B.L. International, Novartis, and Roche Diagnostics. K.B. and H.Z. are co-founders of Brain Biomarker Solutions in Gothenburg AB, a GU Venture-based platform company at the University of Gothenburg. S.L. has consulted for Biogen, Synarc, and Genentech. W.J. serves as a consultant to Bioclinica, Genentech, and Novartis pharmaceuticals. O.H. has acquired research support (for the institution) from Roche, GE Healthcare, Biogen, AVID Radiopharmaceuticals, Fujirebio, and Euroimmun and in the past 2 years, he has received consultancy or speaker fees (paid to the institution) from Lilly, Roche, and Fujirebio. 18F-flutemetamol was generously provided by GE Healthcare in the BioFINDER study.

Figures

Fig. 1
Fig. 1
Regions of Aβ accumulation from longitudinal voxelwise analyses in ADNI. a shows the regions where Aβ fibrils start to accumulate by comparing the annual florbetapir SUVR rate during 2 years between early stage Aβ accumulators (CSF+/PET−, n = 59) and non-accumulators (CSF−/PET−, n = 218). The lateral and medial projections in a show that the most significantly increased accumulation rate among the early Aβ accumulators was located in the posterior cingulate cortex, the precuneus, and the medial orbitofrontal cortex. A PET-data-derived ROI of these early-accumulating Aβ regions is available at http://biofinder.se b confirms the regions in a without biases from a specific CSF Aβ42 cut-off. Here, we performed voxelwise correlations between annual florbetapir SUVR rates and CSF Aβ42 levels in Aβ PET negative individuals (n = 277). To contrast the early stage Aβ regions, c shows the regions with significantly increased annual SUVR rate in late stage Aβ accumulators (CSF+/PET+, n = 191) compared with non-accumulators (CSF−/PET−). A widespread pattern of Aβ accumulation is seen in these non-demented CSF+/PET+ subjects. Voxelwise two-sample t-tests were used and all analyses in ac are adjusted for age and gender. The significant threshold was set at p < 0.001. The red and yellow colors illustrate significant t values according to the scale on the left
Fig. 2
Fig. 2
Distribution of early Aβ accumulation among functional networks in ADNI. The bars show the distribution of the overlap between the significant cluster of early Aβ accumulation (shown in red, see also Fig. 1a) and the functional network ROIs (shown in blue above the bars). The sum of the seven bars is therefore 100%. The pattern of early stage Aβ fibrils overlapped mostly with the DM followed by the FP network. The Jaccard coefficient describes the similarity between the early Aβ accumulation region and the functional network ROIs. It is calculated as the overlap between the early Aβ region and the network ROI/(early Aβ region + network ROI - overlap between early Aβ region and the network ROI). DA dorsal attention, DM default mode, FP frontoparietal, FT frontotemporal, SM sensory motor, VA ventral attention, VI visual network
Fig. 3
Fig. 3
Late Aβ accumulation regions in ADNI. Voxelwise comparisons of annual SUVR change in early Aβ accumulators (CSF+/PET−, n = 59) and late Aβ accumulators (CSF+/PET+, n = 191). A significantly increased SUVR rate is seen in the sensorimotor cortex, occipital lobe, and dorsal temporal lobe in late compared with early Aβ accumulators. Voxelwise two-sample t-tests were used and all comparisons were adjusted for age and gender. The significance threshold was set at p < 0.001. The red and yellow colors illustrate significant t values according to the scale on the left
Fig. 4
Fig. 4
Group comparisons of annual change in brain volume and glucose metabolism in ADNI. a Voxel-based morphometry (VBM) comparison of annual MRI change over 2 years in early Aβ accumulators (CSF+/PET−, n = 59) compared with non-accumulators (CSF−/PET−, n = 218). The results are adjusted for age, gender, and intracranial volume. The contrast is reduction in cortical thickness in early compared with non-accumulators and shows no clear pattern of longitudinal atrophy in the early Aβ accumulators (CSF+/PET−). b The same VBM analysis as in a, but with a comparison between non-accumulators and late Aβ accumulators (CSF+/PET+, n = 191). The contrast is reduction in late compared with non-accumulators and shows a typical AD atrophy pattern in the non-demented late Aβ accumulators (CSF+/PET+). c Voxelwise analysis of annual FDG PET change over 2 years in non-accumulators (n = 153) compared with early Aβ accumulators (n = 41). No significant difference is seen. d The same FDG PET analysis as above, but with a comparison between non-accumulators and late Aβ accumulators (n = 124). The contrast is reduction in glucose metabolism in late compared with early Aβ accumulators and shows a temporal and to a lesser extent parietal reduction in metabolism in the non-demented late Aβ accumulators. Voxelwise two-sample t-tests were used and all results in ad were adjusted for age and gender. The VBM analysis was also adjusted for total intracranial volume. Only voxels with a p < 0.001 are shown. The colors illustrate significant t values according to the scales
Fig. 5
Fig. 5
Replication of the early Aβ regions in BioFINDER. Comparison of 18F-flutemetamol SUVR between early accumulators (CSF+/PET−, n = 30) and non-accumulators (CSF−/PET−, n = 219) in BioFINDER to identify early Aβ regions. The highest significance was seen around the posterior regions of the cingulate cortex and the orbitofrontal cortex similar to the results in ADNI (Fig. 1a, b). Note that the BioFINDER analysis included cross-sectional data and fewer subjects compared to ADNI, which results in less statistical power. Voxelwise two-sample t-test was used. The significance threshold was set at p < 0.001 and the comparison was adjusted for age and gender. The red/yellow colors illustrate significant t values according to the scale on the left
Fig. 6
Fig. 6
Association between functional connectivity and early Aβ accumulation in BioFINDER. a and b show CSF Aβ42 correlations with whole-brain resting-state fMRI connectivity in non-demented subjects with normal Aβ PET and QC-passed fMRI data (n = 103). Nodes were grouped into the 7 networks and 2 subcortical regions in the connectograms (a and b). The connectograms show that the significant network component associated with CSF Aβ42 was qualitatively similar for the CSF+/PET− (a) and CSF-low/PET− (b) groups and consisted mostly of intra- and inter-DM connections. Intra-DM dominated and the strongest inter-DM connection was with the frontoparietal network. The network component of the CSF+/PET− group exhibited reduced connectivity with decreasing CSF Aβ42 (a), r = 0.91, p < 0.001. By contrast, in the qualitatively similar network component of the CSF-low/PET− group, decreasing Aβ42 was instead associated with increased connectivity (b), r = −0.85, p < 0.001. Panel c shows the dominating intra DM-reduction in connectivity for the CSF+/PET− group (a). In summary, a show that Aβ accumulation measured with CSF Aβ42 in early Aβ accumulators is associated with hypoconnectivity in intra- and inter-DM network links. b instead shows that in a population including subjects with even earlier indications of Aβ accumulation (CSF-low/PET−) Aβ accumulation is instead associated with hyperconnectivity in similar neuronal connections. Correlation coefficients (r) refer to Spearman correlation between summed connectivity and CSF Aβ42 levels. Age, gender, and APOE ε4 status was controlled for by partial correlation. Network components correlating with CSF Aβ42 were calculated using a method similar to the NBS algorithm (see “Methods for the BioFINDER study” for statistical details). Acronyms: BG basal ganglia, CSF-low normal CSF Aβ42 levels close to the abnormal cut-off (517–750 ng/L), DA dorsal attention, DM default mode, FP frontoparietal, FT frontotemporal, HI hippocampus, QC quality control, SM sensorimotor, VA ventral attention, VI visual network

Similar articles

Cited by

References

    1. Jack, C. R. Jr. et al. Tracking pathophysiological processes in Alzheimer’s disease: an updated hypothetical model of dynamic biomarkers. Lancet Neurol. 12, 207–216, (2013). - PMC - PubMed
    1. Sperling R, Mormino E, Johnson K. The evolution of preclinical Alzheimer’s disease: implications for prevention trials. Neuron. 2014;84:608–622. doi: 10.1016/j.neuron.2014.10.038. - DOI - PMC - PubMed
    1. Suva D, et al. Primary motor cortex involvement in Alzheimer disease. J Neuropathol. Exp. Neurol. 1999;58:1125–1134. doi: 10.1097/00005072-199911000-00002. - DOI - PubMed
    1. Villain N, et al. Regional dynamics of amyloid-beta deposition in healthy elderly, mild cognitive impairment and Alzheimer’s disease: a voxelwise PiB-PET longitudinal study. Brain. 2012;135:2126–2139. doi: 10.1093/brain/aws125. - DOI - PubMed
    1. Thal DR, Rub U, Orantes M, Braak H. Phases of A beta-deposition in the human brain and its relevance for the development of AD. Neurology. 2002;58:1791–1800. doi: 10.1212/WNL.58.12.1791. - DOI - PubMed

Publication types

MeSH terms

LinkOut - more resources