

Periodontal pathogenic bacteria, Aggregatibacter actinomycetemcomitans affect non-alcoholic fatty liver disease by altering gut microbiota and glucose metabolism
- PMID: 29066788
- PMCID: PMC5655179
- DOI: 10.1038/s41598-017-14260-9
Periodontal pathogenic bacteria, Aggregatibacter actinomycetemcomitans affect non-alcoholic fatty liver disease by altering gut microbiota and glucose metabolism
Erratum in
-
Author Correction: Periodontal pathogenic bacteria, Aggregatibacter actinomycetemcomitans affect non-alcoholic fatty liver disease by altering gut microbiota and glucose metabolism.Sci Rep. 2018 Mar 12;8(1):4620. doi: 10.1038/s41598-018-23000-6. Sci Rep. 2018. PMID: 29531278 Free PMC article.
Abstract
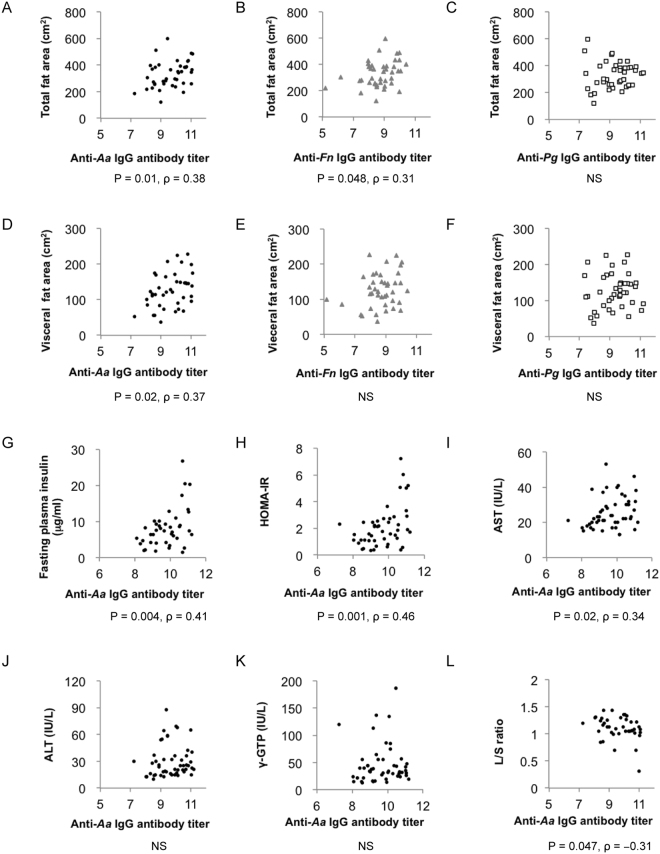
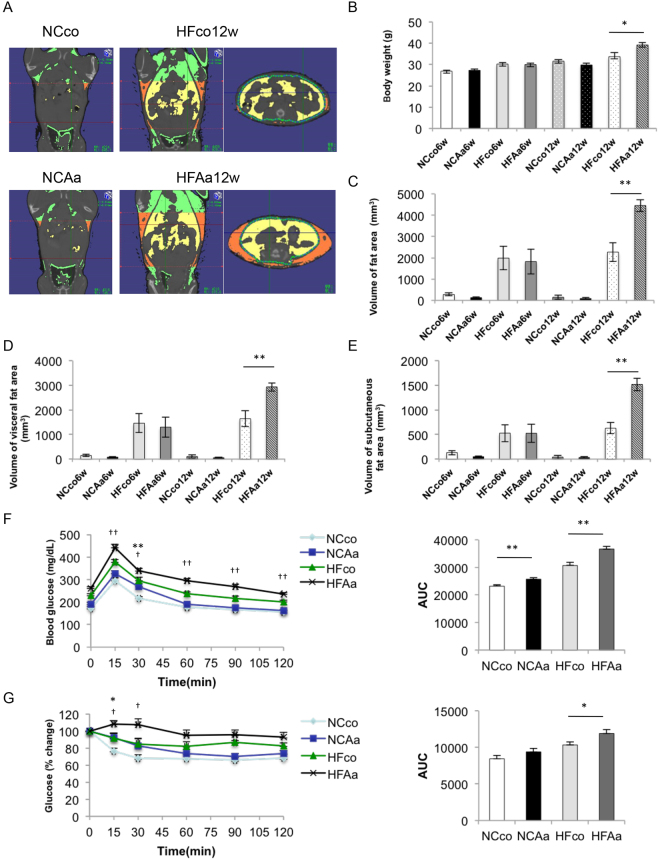
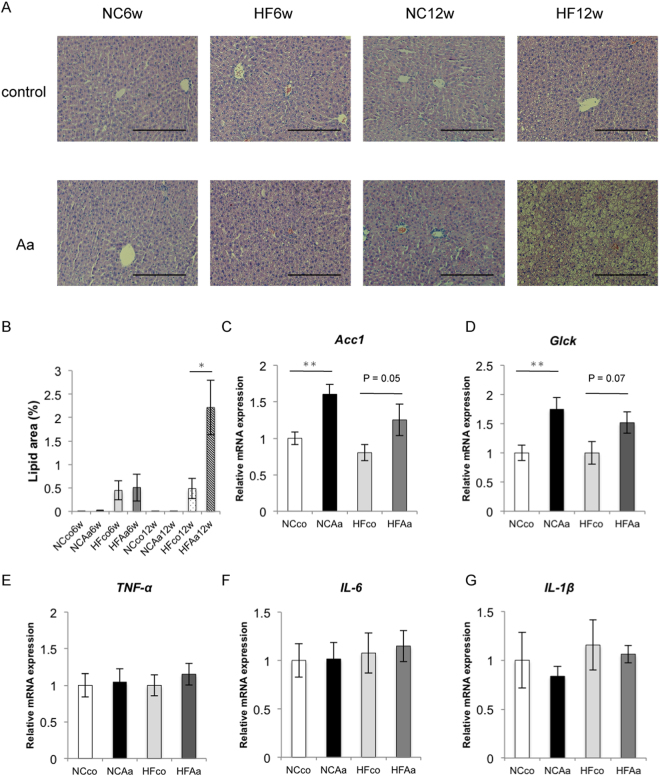
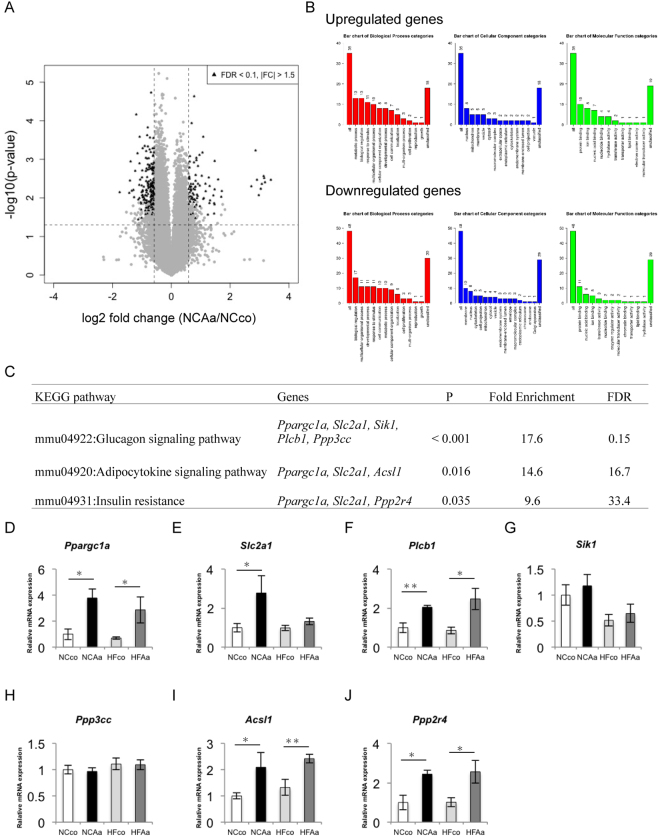
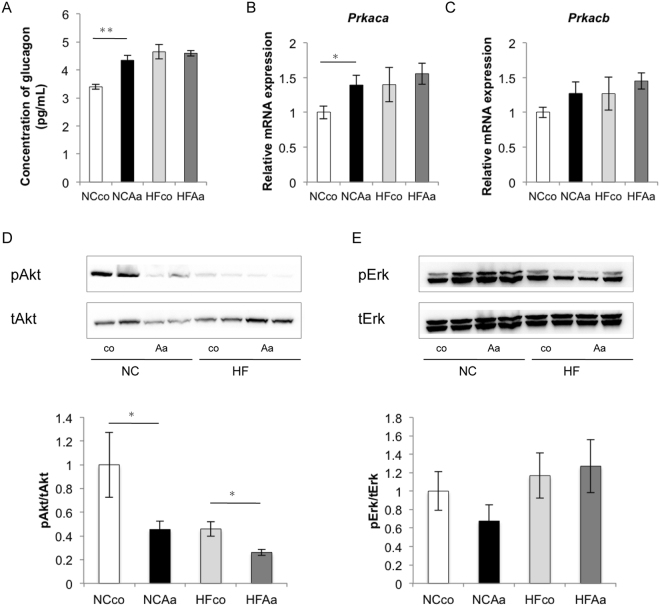
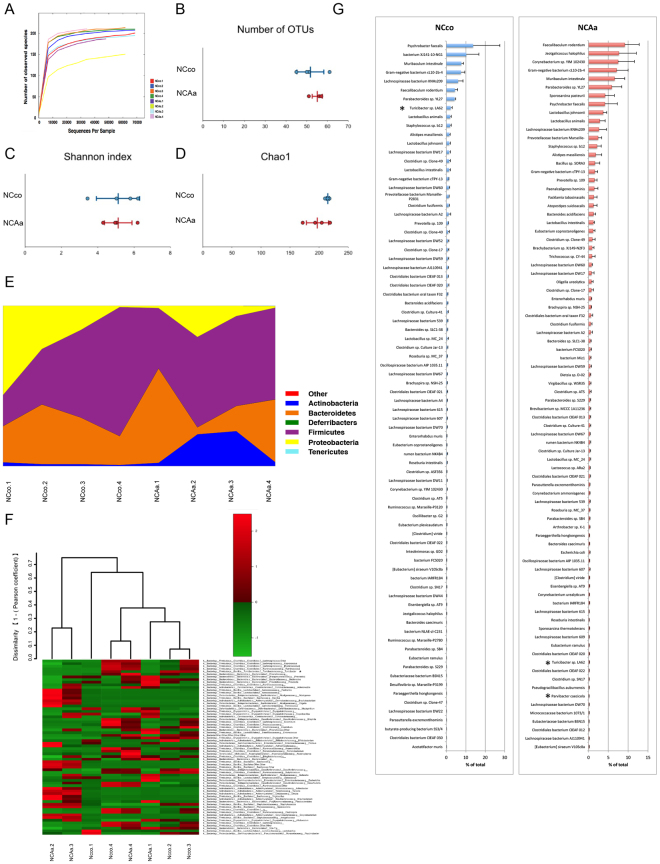
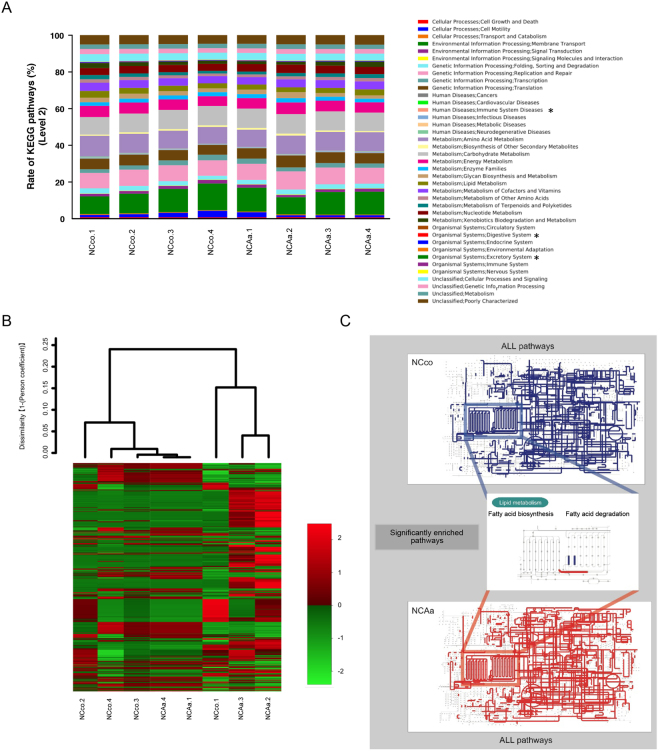
Increasing evidence indicates that periodontitis affects non-alcoholic fatty liver disease (NAFLD). We examined the relationship between periodontal bacterial infection and clinical/biochemical parameters in 52 NAFLD patients. Anti-Aggregatibacter actinomycetemcomitans (Aa) antibody titers correlated positively with visceral fat, fasting plasma insulin, and HOMA-IR; and negatively with the liver/spleen ratio. C57BL/6J mice (8-weeks-old) were given Aa or saline (control) for 6 weeks, and were fed either normal chow (NCAa, NCco) or high-fat diet (HFAa and HFco). NCAa and HFAa mice presented impaired glucose tolerance and insulin resistance compared to control mice. HFAa mice showed higher hepatic steatosis than HFco animals. Liver microarray analysis revealed that 266 genes were differentially expressed between NCAa and NCco mice. Upregulated genes in Aa-administrated mice were enriched for glucagon signaling pathway, adipocytokine signaling pathway and insulin resistance. Consistently, plasma glucagon concentration was higher in NCAa mice. In addition, Akt phosphorylation was lower in the liver of NCAa/HFAa than in NCco/HFco mice. Based on 16S rRNA sequencing, Aa administration changed composition of the gut microbiota. Metagenome prediction in gut microbiota showed upregulation of fatty acid biosynthesis and downregulation of fatty acid degradation in Aa-administered mice. Thus, infection with Aa affects NAFLD by altering the gut microbiota and glucose metabolism.
Conflict of interest statement
The authors declare that they have no competing interests.
Figures
Similar articles
-
Endotoxemia by Porphyromonas gingivalis Injection Aggravates Non-alcoholic Fatty Liver Disease, Disrupts Glucose/Lipid Metabolism, and Alters Gut Microbiota in Mice.Front Microbiol. 2018 Oct 24;9:2470. doi: 10.3389/fmicb.2018.02470. eCollection 2018. Front Microbiol. 2018. PMID: 30405551 Free PMC article.
-
Protective effect of quercetin on high-fat diet-induced non-alcoholic fatty liver disease in mice is mediated by modulating intestinal microbiota imbalance and related gut-liver axis activation.Free Radic Biol Med. 2017 Jan;102:188-202. doi: 10.1016/j.freeradbiomed.2016.11.037. Epub 2016 Nov 25. Free Radic Biol Med. 2017. PMID: 27890642
-
Red pitaya betacyanins protects from diet-induced obesity, liver steatosis and insulin resistance in association with modulation of gut microbiota in mice.J Gastroenterol Hepatol. 2016 Aug;31(8):1462-9. doi: 10.1111/jgh.13278. J Gastroenterol Hepatol. 2016. PMID: 26699443
-
Diet, Gut Microbiota and Non-Alcoholic Fatty Liver Disease: Three Parts of the Same Axis.Cells. 2020 Jan 10;9(1):176. doi: 10.3390/cells9010176. Cells. 2020. PMID: 31936799 Free PMC article. Review.
-
Intestinal hormones, gut microbiota and non-alcoholic fatty liver disease.Minerva Endocrinol. 2017 Jun;42(2):184-194. doi: 10.23736/S0391-1977.16.02567-0. Epub 2016 Nov 23. Minerva Endocrinol. 2017. PMID: 27879962 Review.
Cited by
-
Local and systemic mechanisms linking periodontal disease and inflammatory comorbidities.Nat Rev Immunol. 2021 Jul;21(7):426-440. doi: 10.1038/s41577-020-00488-6. Epub 2021 Jan 28. Nat Rev Immunol. 2021. PMID: 33510490 Free PMC article. Review.
-
Endotoxemia by Porphyromonas gingivalis Alters Endocrine Functions in Brown Adipose Tissue.Front Cell Infect Microbiol. 2021 Jan 19;10:580577. doi: 10.3389/fcimb.2020.580577. eCollection 2020. Front Cell Infect Microbiol. 2021. PMID: 33542905 Free PMC article.
-
ASSOCIATION BETWEEN PERIODONTITIS AND LIVER DISEASE.Acta Clin Croat. 2022 Feb;60(3):510-518. doi: 10.20471/acc.2021.60.03.22. Acta Clin Croat. 2022. PMID: 35282488 Free PMC article. Review.
-
Relationship between NAFLD and Periodontal Disease from the View of Clinical and Basic Research, and Immunological Response.Int J Mol Sci. 2021 Apr 2;22(7):3728. doi: 10.3390/ijms22073728. Int J Mol Sci. 2021. PMID: 33918456 Free PMC article. Review.
-
High Fat Diet Dysbiotic Mechanism of Decreased Gingival Blood Flow.Front Physiol. 2021 Mar 3;12:625780. doi: 10.3389/fphys.2021.625780. eCollection 2021. Front Physiol. 2021. PMID: 33746772 Free PMC article.
References
-
- Liou I, Kowdley KV. Natural history of nonalcoholic steatohepatitis. Journal of clinical gastroenterology. 2006;40(Suppl 1):S11–16. - PubMed
Publication types
MeSH terms
Substances
LinkOut - more resources
Full Text Sources
Other Literature Sources
Medical
