. 2017 Nov 2;68(3):479-490.e5.
doi: 10.1016/j.molcel.2017.09.033. Epub 2017 Oct 19.

Impeding Transcription of Expanded Microsatellite Repeats by Deactivated Cas9

Affiliations

Impeding Transcription of Expanded Microsatellite Repeats by Deactivated Cas9

Belinda S Pinto et al. Mol Cell. .

Abstract

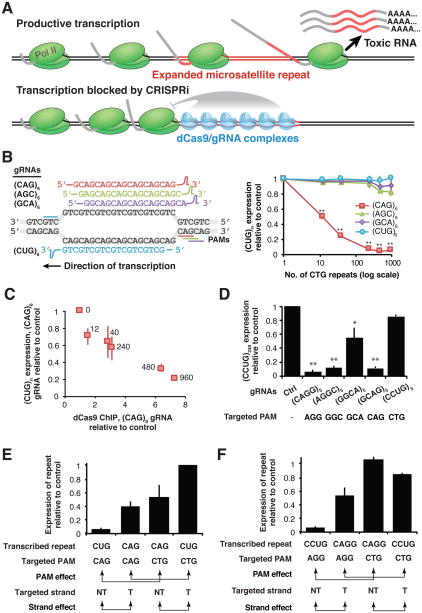
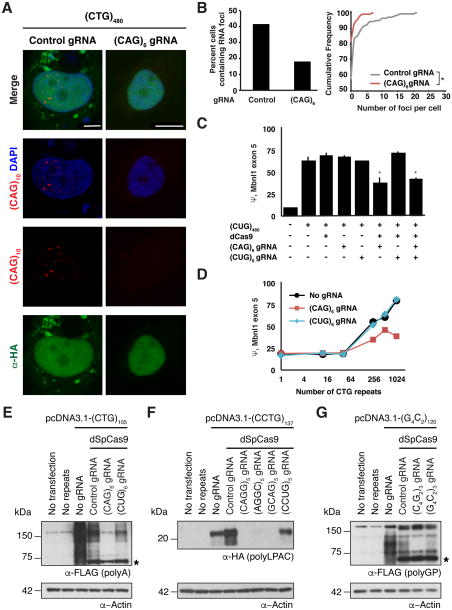
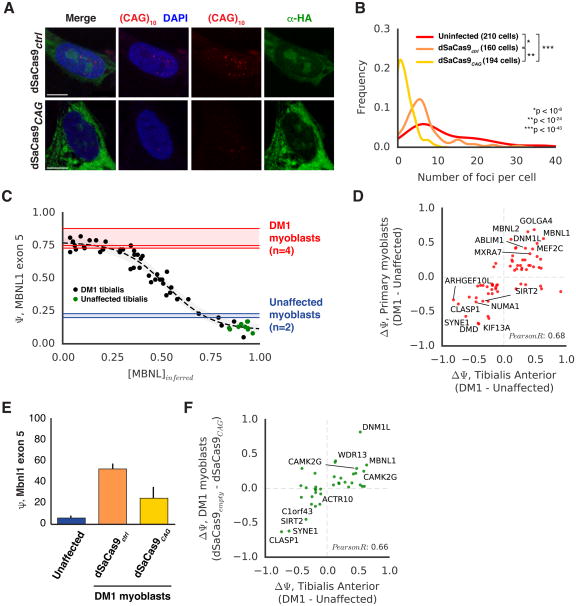
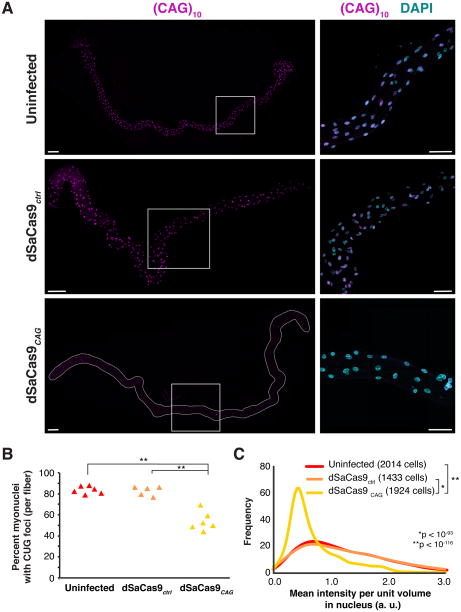
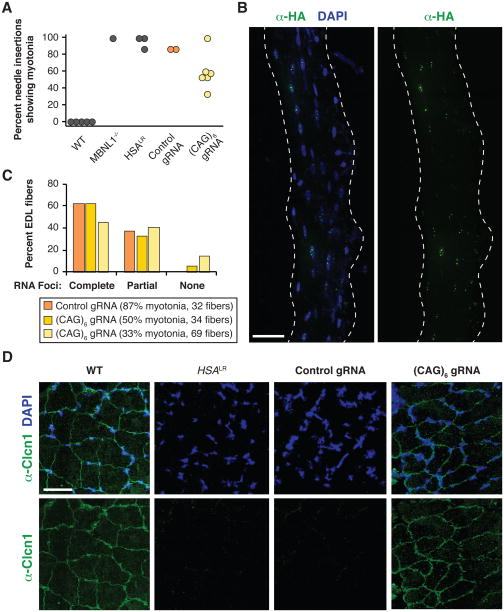
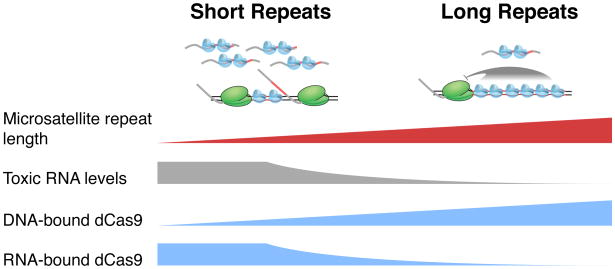
Transcription of expanded microsatellite repeats is associated with multiple human diseases, including myotonic dystrophy, Fuchs endothelial corneal dystrophy, and C9orf72-ALS/FTD. Reducing production of RNA and proteins arising from these expanded loci holds therapeutic benefit. Here, we tested the hypothesis that deactivated Cas9 enzyme impedes transcription across expanded microsatellites. We observed a repeat length-, PAM-, and strand-dependent reduction of repeat-containing RNAs upon targeting dCas9 directly to repeat sequences; targeting the non-template strand was more effective. Aberrant splicing patterns were rescued in DM1 cells, and production of RAN peptides characteristic of DM1, DM2, and C9orf72-ALS/FTD cells was drastically decreased. Systemic delivery of dCas9/gRNA by adeno-associated virus led to reductions in pathological RNA foci, rescue of chloride channel 1 protein expression, and decreased myotonia. These observations suggest that transcription of microsatellite repeat-containing RNAs is more sensitive to perturbation than transcription of other RNAs, indicating potentially viable strategies for therapeutic intervention.

Keywords: C9ORF72/ALS/FTD; CRISPR; Cas9; RNA polymerase II; RNA toxicity; amyotrophic lateral sclerosis; microsatellite repeat disease; myotonic dystrophy; transcription.


Figures

Figure 1
Figure 1. Deactivated SpCas9 impedes transcription of expanded microsatellite repeats in a length-, PAM-, and strand-dependent manner
A) Proposed model for how recruitment of dCas9/gRNA complexes to expanded microsatellite repeats impedes transcription by RNA Pol II B) Schematic of gRNAs used to target transcription of CTG repeats (left panel). Abundance of CUG repeat RNA in the presence of dCas9/gRNAs targeting the repeat tracts of various lengths in HeLa cells, relative to the same RNA species with zero repeats (right panel). Error bars show standard deviation. C) Relative dCas9 ChIP signal across all repeat lengths versus percent RNA remaining following (CAG)6 gRNA relative to control gRNA treatment. dCas9 ChIP signal is computed as dCas9 IP divided by input chromatin with (CAG)6 gRNA treatment, divided by dCas9 IP divided by input chromatin with control gRNA treatment. Relative abundance of repeat-containing loci and RNAs was assessed by deep sequencing of the barcodes. Error bars show standard error of the mean. D) Abundance of CCUG repeat RNA in the presence of dCas9 and gRNAs targeting the (CCTG)240 repeat tract in HeLa cells, relative to the same RNA species with zero repeats. E) Abundance of RNAs containing 960 CUG or CAG repeats in the presence of dCas9 and (CUG)6 or (CAG)6 gRNAs in HeLa cells, relative to RNA species with zero repeats. Arrows denote comparisons relevant for assessing PAM- or strand-dependent effects on efficacy. F) Abundance of RNAs containing 240 CCUG or CAGG repeats in the presence of dCas9 and (CCUG)5 or (CAGG)5 gRNAs in HeLa cells, relative to RNA species with zero repeats. Arrows denote comparisons relevant for assessing PAM- or strand-dependent effects on efficacy. (All significance tests are by two-tailed T-test, **p < 0.0005, *p < 0.005)
Figure 2
Figure 2. Transcriptional inhibition rescues molecular and cellular phenotypes in cell culture models of DM1, DM2, and C9ORF72/ALS/FTD
A) Representative FISH-IF images of HeLa cells transfected with plasmids expressing (CTG)480 repeats, HA-dCas9 and control or (CAG)6 gRNAs. RNA foci are shown in red, dCas9 in green and DNA (DAPI) in blue. Scale bar: 10mm B) Quantitation of HA-positive cells showing nuclear RNA foci (left panel) and the cumulative density function of HA-positive cells with a given number of RNA foci (right panel), in the presence of dCas9 and control or (CAG)6 gRNAs (Control: 139 cells, (CAG)6: 111 cells, Kolmogorov–Smirnov test, *p < 0.005). C) Ψ of MBNL1 exon 5 expressed in a minigene context in HeLa cells, in the presence of combinations of plasmids encoding (CTG)480 repeats, dCas9, and (CAG)6 or (CUG)6 gRNAs. N > 3 for all conditions (two-tailed T-test, *p < 0.005) D) Ψ of the MBNL1 exon 5 minigene in HeLas, in the presence of plasmids encoding 0, 12, 40, 240, 480, or 960 CTG repeats, as well as dCas9 and (CAG)6 or (CUG)6 gRNAs. N > 3 for all conditions. Error bars are too small to be visible. E) Western blot to detect FLAG-tagged poly-Ala RAN peptides expressed from DM1 CTG repeats. Cells were transfected with various combinations of plasmids encoding no or (CTG)105 repeats with combinations of dCas9 and control, (CAG)6 or (CUG)6 gRNAs. The peptides migrate as a 75 and 150 kD smear. The asterisk indicates a cross-reacting protein produced by the dSpCas9 plasmid. F) Western blot against the HA-tagged LPAC RAN protein expressed from DM2 CCTG repeats. Cells were transfected with various combinations of plasmids encoding no or (CCTG)137 repeats with combinations of dCas9 and control, (CAGG)5, (AGGC)5, (GCAG)5 or (CCUG)5, gRNAs. The peptide migrates at 20 kD. G) Western blot against the FLAG-tagged poly-GlyPro RAN protein expressed from ALS G4C2 repeats. Cells were transfected with various combinations of plasmids encoding no or (G4C2)120 repeats with combinations of dCas9 and control, (C4G2)3 or (G4C2)3 gRNAs. The peptides migrate as a 75 and 120 kD smear. The asterisk indicates a cross-reacting protein produced by the dSpCas9 plasmid, β-Actin serves as the loading control and N = 3 for E, F and G (representative blot shown).
Figure 3
Figure 3. AAV-dSaCas9 rescues molecular and cellular phenotypes in human DM1 myoblasts
A) Representative FISH-IF images of DM1 myoblasts infected with AAV-dSaCas9- control or (CAG)6 gRNAs. RNA foci are shown in red, dCas9 in green, and DAPI in blue. Scale bar: 10μm B) Probability density function of cells with a given number of RNA foci, in the presence of control or (CAG)6 gRNAs (Kolmogorov–Smirnov test for statistical significance). C) MISO estimates of MBNL1 exon 5 Ψ in 11 unaffected and 44 DM1 TA biopsies plotted in order of [MBNL]inferred as previously described. A sigmoid curve was fit to these points and shown (dashed line) with 90% confidence intervals (gray shading). MISO estimates of MBNL1 exon 5 Ψ values in unaffected and DM1 primary myoblast lines (2 and 4 replicates, respectively) are shown in blue and red lines, respectively, with ranges also shaded. D) Scatter plot for splicing events regulated in both TA biopsies and the human myoblast lines described in (C). 115 splicing events were selected from TA biopsies based on best sigmoid fits with [MBNL]inferred as in (C). The x-axis of the scatter plot is the mean Ψ in the most severely affected biopsies (<0.33 [MBNL]inferred) minus the mean Ψ across unaffected individuals. The y-axis of the scatter plot is the mean Ψ in the DM1 myoblast minus the mean Ψ in the unaffected myoblast line. Labeled points have ΔΨ>0.3 in both conditions, a sigmoid fit<1.3, and a y-axis monotonicity score>1 (see Methods). Pearson correlation is listed. E) MBNL1 exon 5 Ψ, assessed by RT-PCR in unaffected myoblasts and DM1 myoblasts infected with AAV-dSaCas9-control or (CAG)6 gRNAs. F) Scatter plot illustrating changes in Ψ in response to AAV-dSaCas9 (CAG)6 gRNA, for splicing events exhibiting concordant behavior in (D). The x-axis is as in (D), but the y-axis is ΔΨ in DM1 myoblasts, AAV-dSaCas9-control gRNA treatment minus AAV-dSaCas9-(CAG)6 gRNA treatment. Labeled points have ΔΨ>0.1 in both conditions and a y-axis Bayes Factor>5 (see Methods). Pearson correlation is listed.
Figure 4
Figure 4
AAV-dSaCas9-(CAG)6 reduces RNA foci in HSALR muscle fibers. A) FISH to detect nuclear RNA foci (magenta) in myonuclei of HSALR EDL muscle fibers that were untreated (top), infected with AAV-dSaCas9-control gRNA (middle) or (CAG)6 gRNA (bottom). A representative fiber for each condition is shown (Scale bar: 100 μm). Insets from each fiber (white boxes) are on the right (Scale bar: 50 mm). DAPI is in cyan. B) The percentage of myonuclei per fiber showing RNA foci was quantitated across all 3 conditions with 5-6 fibers per condition, 400-500 nuclei per fiber (two-tailed T-test, **p<0.0005). C) Probability density function of intensity of FISH signal in myonuclei from untreated fibers (red), fibers infected with AAV-dSaCas9-control gRNA (orange) or AAV-dSaCas9-(CAG)6 gRNA (yellow). A Kolmogorov–Smirnov test was performed for statistical significance.
Figure 5
Figure 5
AAV6-dSaCas9-(CAG)6 rescues muscle phenotypes in HSALR mice. A) Percent needle insertions showing a myotonic run in wild type FVB, MBNL1-/-, HSALR (black) and HSALR treated with AAV6-dSaCas9-control gRNA (orange) or (CAG)6 gRNA (yellow). Each point represents a muscle from a single animal, but in some animals, two muscles were assayed. (p<0.027 for AAV6-dSaCas9-control versus AAV6-dSaCas9-CAG6 treated animals, two-tailed T-test) B) IF against HA-dSaCas9 (green) in an EDL fiber from a mouse treated with AAV6-dSaCas9-(CAG)6 gRNA. DAPI is in blue Scale bar: 50 μm. C) Quantitation of EDL fibers with complete, partial, or no CUG RNA foci upon treatment with AAV6-dSaCas9-control or (CAG)6 gRNA. Myotonia levels and numbers of fibers analyzed are also listed. D) IF against Clcn1 in TA muscle sections from FVB, HSALR, and HSALR treated with AAV-dSaCas9-control or (CAG)6 gRNA. DAPI is shown in blue. Scale bar: 50 μm.
Figure 6
Figure 6. Model for microsatellite repeat expansion targeting by dCas9
dCas9 binding to DNA impedes transcription of long, expanded microsatellite repeats. In the context of shorter repeats, fewer copies of DNA-bound dCas9 may be insufficient to fully inhibit elongation by RNA Pol II, permitting production of RNA that can also be targeted by dCas9.

Similar articles

Cited by

References

    1. Nelson DL, Orr HT, Warren ST. The unstable repeats--three evolving faces of neurological disease. Neuron. 2013;77:825–43. - PMC - PubMed
    1. Kennedy L, Evans E, Chen CM, Craven L, Detloff PJ, Ennis M, Shelbourne PF. Dramatic tissue-specific mutation length increases are an early molecular event in Huntington disease pathogenesis. Hum Mol Genet. 2003;12:3359–67. - PubMed
    1. Thornton CA, Johnson K, Moxley RT., 3rd Myotonic dystrophy patients have larger CTG expansions in skeletal muscle than in leukocytes. Ann Neurol. 1994;35:104–7. - PubMed
    1. Miller JW, Urbinati CR, Teng-Umnuay P, Stenberg MG, Byrne BJ, Thornton CA, Swanson MS. Recruitment of human muscleblind proteins to (CUG)(n) expansions associated with myotonic dystrophy. EMBO J. 2000;19:4439–48. - PMC - PubMed
    1. Kanadia RN, Johnstone KA, Mankodi A, Lungu C, Thornton CA, Esson D, Timmers AM, Hauswirth WW, Swanson MS. A muscleblind knockout model for myotonic dystrophy. Science. 2003;302:1978–80. - PubMed

MeSH terms