A novel and fully automated mammographic texture analysis for risk prediction: results from two case-control studies
- PMID: 29047382
- PMCID: PMC5648465
- DOI: 10.1186/s13058-017-0906-6
A novel and fully automated mammographic texture analysis for risk prediction: results from two case-control studies
Abstract
Background: The percentage of mammographic dense tissue (PD) is an important risk factor for breast cancer, and there is some evidence that texture features may further improve predictive ability. However, relatively little work has assessed or validated textural feature algorithms using raw full field digital mammograms (FFDM).
Method: A case-control study nested within a screening cohort (age 46-73 years) from Manchester UK was used to develop a texture feature risk score (264 cases diagnosed at the same time as mammogram of the contralateral breast, 787 controls) using the least absolute shrinkage and selection operator (LASSO) method for 112 features, and validated in a second case-control study from the same cohort but with cases diagnosed after the index mammogram (317 cases, 931 controls). Predictive ability was assessed using deviance and matched concordance index (mC). The ability to improve risk estimation beyond percent volumetric density (Volpara) was evaluated using conditional logistic regression.
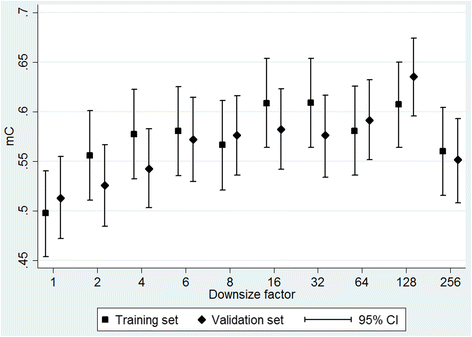
Results: The strongest features identified in the training set were "sum average" based on the grey-level co-occurrence matrix at low image resolutions (original resolution 10.628 pixels per mm; downsized by factors of 16, 32 and 64), which had a better deviance and mC than volumetric PD. In the validation study, the risk score combining the three sum average features achieved a better deviance than volumetric PD (Δχ2 = 10.55 or 6.95 if logarithm PD) and a similar mC to volumetric PD (0.58 and 0.57, respectively). The risk score added independent information to volumetric PD (Δχ2 = 14.38, p = 0.0008).
Conclusion: Textural features based on digital mammograms improve risk assessment beyond volumetric percentage density. The features and risk score developed need further investigation in other settings.
Keywords: Breast cancer; Breast density; Digital mammogram; Risk prediction; Texture.
Conflict of interest statement
Ethics approval and consent to participate
The PROCAS study was approved by Central Manchester Research Ethics Committee (reference: 09/H1008/81) and consent was obtained from study participants at the time of screening.
Consent for publication
Not applicable.
Competing interests
The authors declare that they have no competing interests.
Publisher’s Note
Springer Nature remains neutral with regard to jurisdictional claims in published maps and institutional affiliations.
Figures


Similar articles
-
Exploring the prediction performance for breast cancer risk based on volumetric mammographic density at different thresholds.Breast Cancer Res. 2018 Jun 8;20(1):49. doi: 10.1186/s13058-018-0979-x. Breast Cancer Res. 2018. PMID: 29884207 Free PMC article.
-
A novel method of determining breast cancer risk using parenchymal textural analysis of mammography images on an Asian cohort.Phys Med Biol. 2019 Jan 31;64(3):035016. doi: 10.1088/1361-6560/aafabd. Phys Med Biol. 2019. PMID: 30577031
-
Evaluation of LIBRA Software for Fully Automated Mammographic Density Assessment in Breast Cancer Risk Prediction.Radiology. 2020 Jul;296(1):24-31. doi: 10.1148/radiol.2020192509. Epub 2020 May 12. Radiology. 2020. PMID: 32396041 Free PMC article.
-
Beyond breast density: a review on the advancing role of parenchymal texture analysis in breast cancer risk assessment.Breast Cancer Res. 2016 Sep 20;18(1):91. doi: 10.1186/s13058-016-0755-8. Breast Cancer Res. 2016. PMID: 27645219 Free PMC article. Review.
-
Repeated measures of mammographic density and texture to evaluate prediction and risk of breast cancer: a systematic review of the methods used in the literature.Cancer Causes Control. 2023 Nov;34(11):939-948. doi: 10.1007/s10552-023-01739-2. Epub 2023 Jun 20. Cancer Causes Control. 2023. PMID: 37340148 Free PMC article. Review.
Cited by
-
Differentiation of Endometriomas from Ovarian Hemorrhagic Cysts at Magnetic Resonance: The Role of Texture Analysis.Medicina (Kaunas). 2020 Sep 23;56(10):487. doi: 10.3390/medicina56100487. Medicina (Kaunas). 2020. PMID: 32977428 Free PMC article.
-
Sensitivity of screening mammography by density and texture: a cohort study from a population-based screening program in Denmark.Breast Cancer Res. 2019 Oct 17;21(1):111. doi: 10.1186/s13058-019-1203-3. Breast Cancer Res. 2019. PMID: 31623646 Free PMC article.
-
CT texture analysis predicts abdominal aortic aneurysm post-endovascular aortic aneurysm repair progression.Sci Rep. 2020 Jul 23;10(1):12268. doi: 10.1038/s41598-020-69226-1. Sci Rep. 2020. PMID: 32703988 Free PMC article.
-
Measurement challenge: protocol for international case-control comparison of mammographic measures that predict breast cancer risk.BMJ Open. 2019 Dec 31;9(12):e031041. doi: 10.1136/bmjopen-2019-031041. BMJ Open. 2019. PMID: 31892647 Free PMC article.
-
Associations of Oral Contraceptives with Mammographic Breast Density in Premenopausal Women.Cancer Epidemiol Biomarkers Prev. 2022 Feb;31(2):436-442. doi: 10.1158/1055-9965.EPI-21-0853. Epub 2021 Dec 3. Cancer Epidemiol Biomarkers Prev. 2022. PMID: 34862209 Free PMC article.
References
-
- Keller BM, Nathan DL, Wang Y, Zheng YJ, Gee JC, Conant EF, et al. Estimation of breast percent density in raw and processed full field digital mammography images via adaptive fuzzy c-means clustering and support vector machine segmentation. Med Phys. 2012;39:4903–17. doi: 10.1118/1.4736530. - DOI - PMC - PubMed
MeSH terms
Grants and funding
LinkOut - more resources
Full Text Sources
Other Literature Sources
Medical

