

High-Fat Diet Changes Fungal Microbiomes and Interkingdom Relationships in the Murine Gut
- PMID: 29034327
- PMCID: PMC5636226
- DOI: 10.1128/mSphere.00351-17
High-Fat Diet Changes Fungal Microbiomes and Interkingdom Relationships in the Murine Gut
Abstract
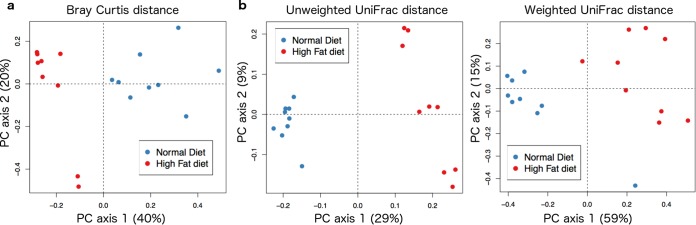
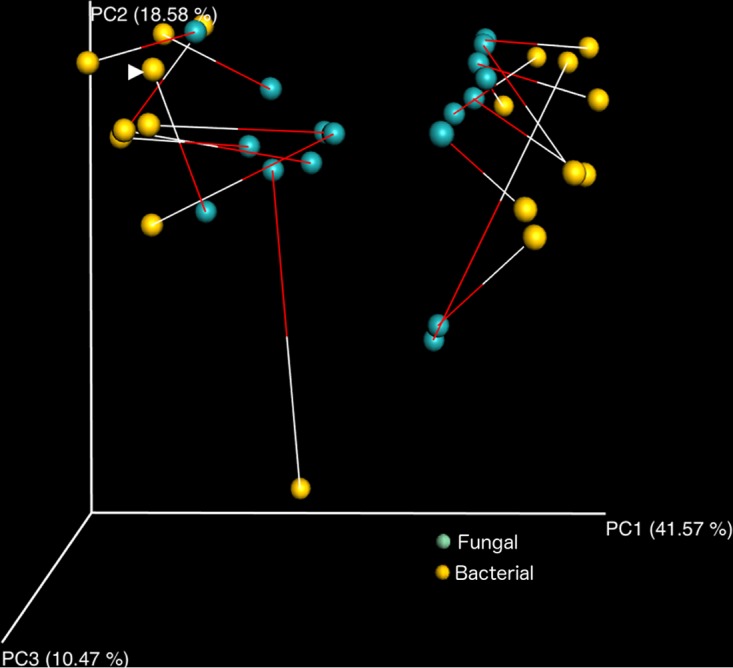
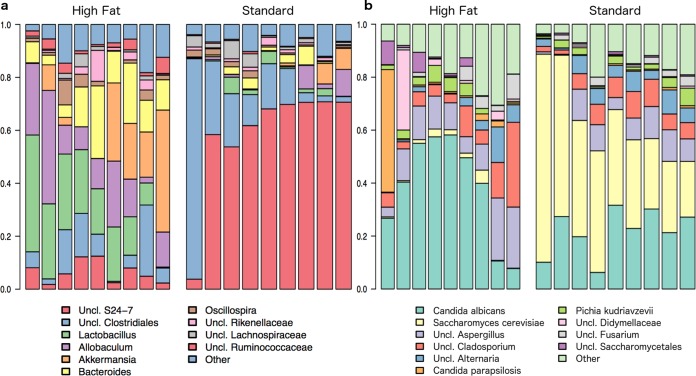
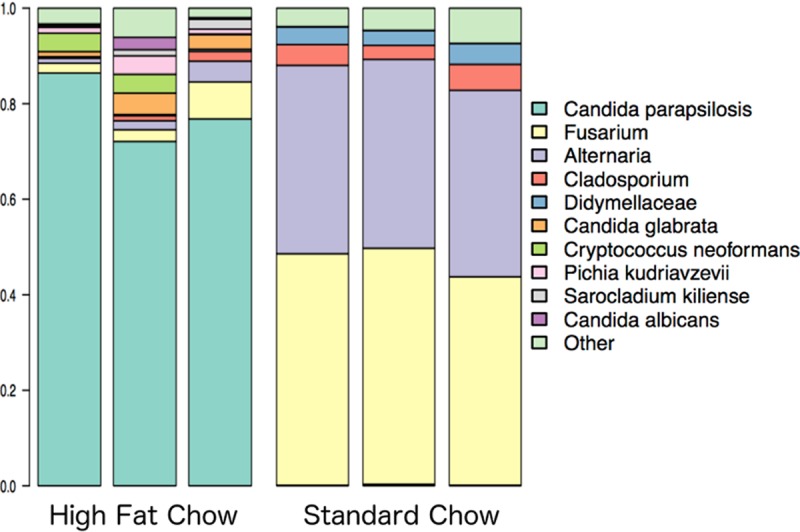
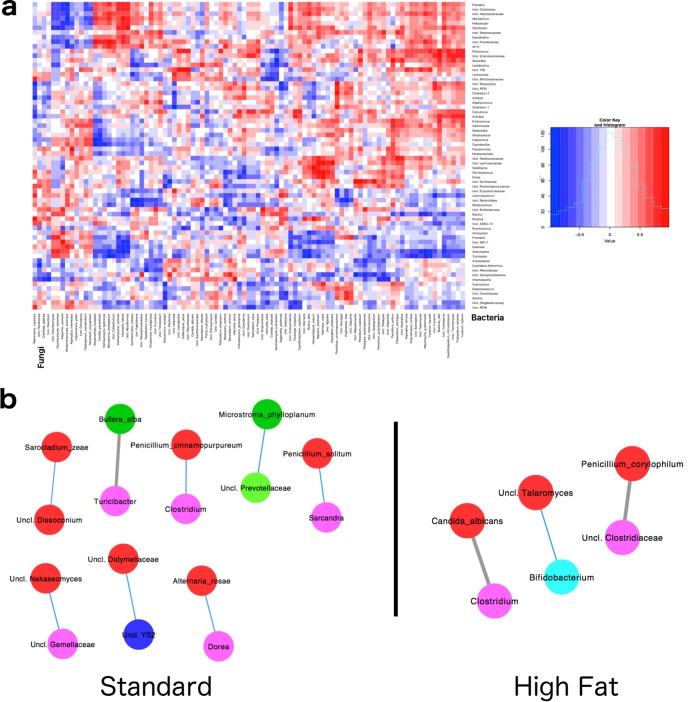
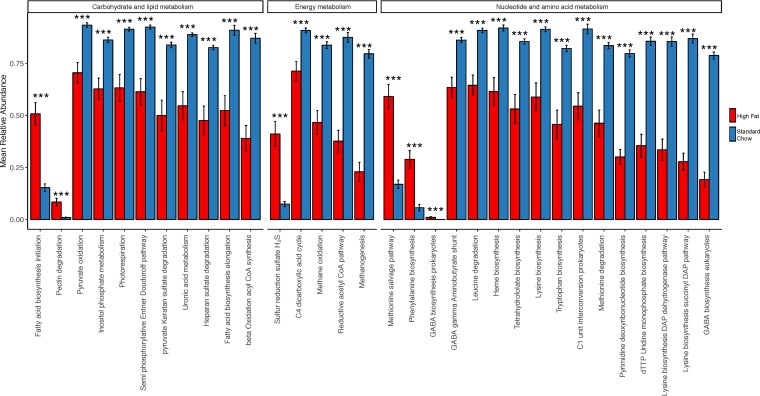
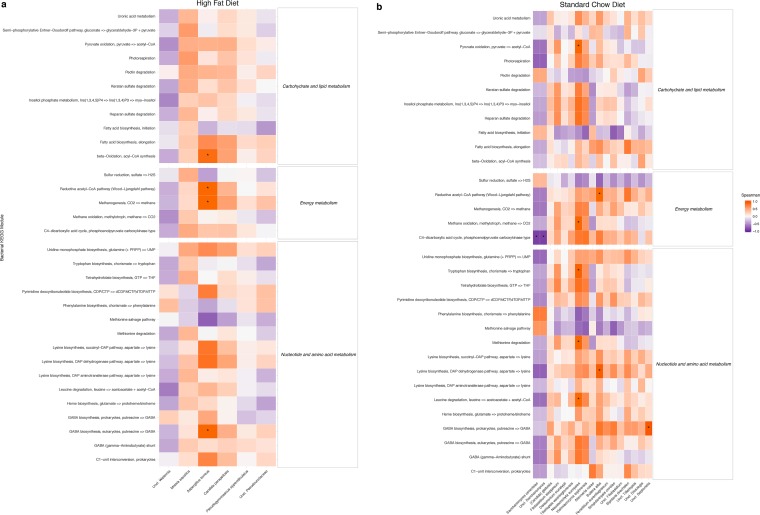
Dietary fat intake and shifts in gut bacterial community composition are associated with the development of obesity. To date, characterization of microbiota in lean versus obese subjects has been dominated by studies of gut bacteria. Fungi, recently shown to affect gut inflammation, have received little study for their role in obesity. We sought to determine the effects of high-fat diet on fungal and bacterial community structures in a mouse model using the internal transcribed spacer region 2 (ITS2) of fungal ribosomal DNA (rDNA) and the 16S rRNA genes of bacteria. Mice fed a high-fat diet had significantly different abundances of 19 bacterial and 6 fungal taxa than did mice fed standard chow, with high-fat diet causing similar magnitudes of change in overall fungal and bacterial microbiome structures. We observed strong and complex diet-specific coabundance relationships between intra- and interkingdom microbial pairs and dramatic reductions in the number of coabundance correlations in mice fed a high-fat diet compared to those fed standard chow. Furthermore, predicted microbiome functional modules related to metabolism were significantly less abundant in high-fat-diet-fed than in standard-chow-fed mice. These results suggest a role for fungi and interkingdom interactions in the association between gut microbiomes and obesity. IMPORTANCE Recent research shows that gut microbes are involved in the development of obesity, a growing health problem in developed countries that is linked to increased risk for cardiovascular disease. However, studies showing links between microbes and metabolism have been limited to the analysis of bacteria and have ignored the potential contribution of fungi in metabolic health. This study provides evidence that ingestion of a high-fat diet is associated with changes to the fungal (and bacterial) microbiome in a mouse model. In addition, we find that interkingdom structural and functional relationships exist between fungi and bacteria within the gut and that these are perturbed by high-fat diet.
Keywords: fungal-bacterial interactions; fungi; high-fat diet; microbiome; obesity.
Figures
Similar articles
-
Pregnancy-related changes in the maternal gut microbiota are dependent upon the mother's periconceptional diet.Gut Microbes. 2015;6(5):310-20. doi: 10.1080/19490976.2015.1086056. Gut Microbes. 2015. PMID: 26322500 Free PMC article.
-
Bacterial, fungal, and interkingdom microbiome features of exclusively breastfeeding dyads are associated with infant age, antibiotic exposure, and birth mode.Front Microbiol. 2022 Nov 17;13:1050574. doi: 10.3389/fmicb.2022.1050574. eCollection 2022. Front Microbiol. 2022. PMID: 36466688 Free PMC article.
-
Gut carbohydrate metabolism instead of fat metabolism regulated by gut microbes mediates high-fat diet-induced obesity.Benef Microbes. 2014 Sep;5(3):335-44. doi: 10.3920/BM2013.0071. Benef Microbes. 2014. PMID: 24675232
-
The gut microbiota, obesity and insulin resistance.Mol Aspects Med. 2013 Feb;34(1):39-58. doi: 10.1016/j.mam.2012.11.001. Epub 2012 Nov 16. Mol Aspects Med. 2013. PMID: 23159341 Review.
-
Gut microbiota of humans, dogs and cats: current knowledge and future opportunities and challenges.Br J Nutr. 2015 Jan;113 Suppl:S6-17. doi: 10.1017/S0007114514002943. Epub 2014 Nov 21. Br J Nutr. 2015. PMID: 25414978 Review.
Cited by
-
From Birth and Throughout Life: Fungal Microbiota in Nutrition and Metabolic Health.Annu Rev Nutr. 2020 Sep 23;40:323-343. doi: 10.1146/annurev-nutr-013120-043659. Epub 2020 Jul 17. Annu Rev Nutr. 2020. PMID: 32680437 Free PMC article.
-
The Short-Term Variation of Human Gut Mycobiome in Response to Dietary Intervention of Different Macronutrient Distributions.Nutrients. 2023 Apr 29;15(9):2152. doi: 10.3390/nu15092152. Nutrients. 2023. PMID: 37432284 Free PMC article. Clinical Trial.
-
Crossing Kingdoms: How the Mycobiota and Fungal-Bacterial Interactions Impact Host Health and Disease.Infect Immun. 2021 Mar 17;89(4):e00648-20. doi: 10.1128/IAI.00648-20. Print 2021 Mar 17. Infect Immun. 2021. PMID: 33526565 Free PMC article. Review.
-
The gut mycobiome: a novel player in chronic liver diseases.J Gastroenterol. 2021 Jan;56(1):1-11. doi: 10.1007/s00535-020-01740-5. Epub 2020 Nov 5. J Gastroenterol. 2021. PMID: 33151407 Free PMC article. Review.
-
The gut mycobiome of healthy mice is shaped by the environment and correlates with metabolic outcomes in response to diet.Commun Biol. 2021 Mar 5;4(1):281. doi: 10.1038/s42003-021-01820-z. Commun Biol. 2021. PMID: 33674757 Free PMC article.
References
-
- Hildebrandt MA, Hoffmann C, Sherrill-Mix SA, Keilbaugh SA, Hamady M, Chen YY, Knight R, Ahima RS, Bushman F, Wu GD. 2009. High-fat diet determines the composition of the murine gut microbiome independently of obesity. Gastroenterology 137:1716–1724.e1. doi:10.1053/j.gastro.2009.08.042. - DOI - PMC - PubMed
Grants and funding
LinkOut - more resources
Full Text Sources
Other Literature Sources
