Landscape of X chromosome inactivation across human tissues
- PMID: 29022598
- PMCID: PMC5685192
- DOI: 10.1038/nature24265
Landscape of X chromosome inactivation across human tissues
Erratum in
-
Corrigendum: Landscape of X chromosome inactivation across human tissues.Nature. 2018 Mar 7;555(7695):274. doi: 10.1038/nature25993. Nature. 2018. PMID: 29517003
Abstract
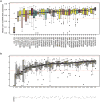
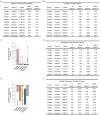
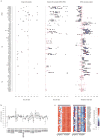
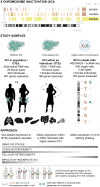
X chromosome inactivation (XCI) silences transcription from one of the two X chromosomes in female mammalian cells to balance expression dosage between XX females and XY males. XCI is, however, incomplete in humans: up to one-third of X-chromosomal genes are expressed from both the active and inactive X chromosomes (Xa and Xi, respectively) in female cells, with the degree of 'escape' from inactivation varying between genes and individuals. The extent to which XCI is shared between cells and tissues remains poorly characterized, as does the degree to which incomplete XCI manifests as detectable sex differences in gene expression and phenotypic traits. Here we describe a systematic survey of XCI, integrating over 5,500 transcriptomes from 449 individuals spanning 29 tissues from GTEx (v6p release) and 940 single-cell transcriptomes, combined with genomic sequence data. We show that XCI at 683 X-chromosomal genes is generally uniform across human tissues, but identify examples of heterogeneity between tissues, individuals and cells. We show that incomplete XCI affects at least 23% of X-chromosomal genes, identify seven genes that escape XCI with support from multiple lines of evidence and demonstrate that escape from XCI results in sex biases in gene expression, establishing incomplete XCI as a mechanism that is likely to introduce phenotypic diversity. Overall, this updated catalogue of XCI across human tissues helps to increase our understanding of the extent and impact of the incompleteness in the maintenance of XCI.
Figures


Comment in
-
Human genomics: Cracking the regulatory code.Nature. 2017 Oct 11;550(7675):190-191. doi: 10.1038/550190a. Nature. 2017. PMID: 29022577 No abstract available.
-
A more personal view of human-gene regulation.Nature. 2017 Oct 11;550(7675):157. doi: 10.1038/550157a. Nature. 2017. PMID: 29022932 No abstract available.
-
Gene-expression study raises thorny ethical issues.Nature. 2017 Oct 11;550(7675):169-170. doi: 10.1038/550169a. Nature. 2017. PMID: 29022940 No abstract available.
-
Gene expression: Principles of gene regulation across tissues.Nat Rev Genet. 2017 Dec;18(12):701. doi: 10.1038/nrg.2017.94. Epub 2017 Nov 7. Nat Rev Genet. 2017. PMID: 29109523 No abstract available.
-
COVID-19 and ACE2 in the Liver and Gastrointestinal Tract: Putative Biological Explanations of Sexual Dimorphism.Gastroenterology. 2020 Oct;159(4):1620-1621. doi: 10.1053/j.gastro.2020.04.050. Epub 2020 Apr 26. Gastroenterology. 2020. PMID: 32348773 Free PMC article. No abstract available.
Similar articles
-
Genes that escape from X-chromosome inactivation: Potential contributors to Klinefelter syndrome.Am J Med Genet C Semin Med Genet. 2020 Jun;184(2):226-238. doi: 10.1002/ajmg.c.31800. Epub 2020 May 22. Am J Med Genet C Semin Med Genet. 2020. PMID: 32441398 Free PMC article. Review.
-
Escape from X-inactivation in twins exhibits intra- and inter-individual variability across tissues and is heritable.PLoS Genet. 2023 Feb 21;19(2):e1010556. doi: 10.1371/journal.pgen.1010556. eCollection 2023 Feb. PLoS Genet. 2023. PMID: 36802379 Free PMC article.
-
Female-bias in systemic lupus erythematosus: How much is the X chromosome to blame?Biol Sex Differ. 2024 Oct 7;15(1):76. doi: 10.1186/s13293-024-00650-y. Biol Sex Differ. 2024. PMID: 39375734 Free PMC article. Review.
-
Analysis of expressed SNPs identifies variable extents of expression from the human inactive X chromosome.Genome Biol. 2013 Nov 1;14(11):R122. doi: 10.1186/gb-2013-14-11-r122. Genome Biol. 2013. PMID: 24176135 Free PMC article.
-
X-chromosome inactivation in human iPSCs provides insight into X-regulated gene expression in autosomes.Genome Biol. 2024 May 31;25(1):144. doi: 10.1186/s13059-024-03286-8. Genome Biol. 2024. PMID: 38822397 Free PMC article.
Cited by
-
Epigenetic control of chromosome-associated lncRNA genes essential for replication and stability.Nat Commun. 2022 Oct 22;13(1):6301. doi: 10.1038/s41467-022-34099-7. Nat Commun. 2022. PMID: 36273230 Free PMC article.
-
Androgen regulation of pulmonary AR, TMPRSS2 and ACE2 with implications for sex-discordant COVID-19 outcomes.Sci Rep. 2021 May 27;11(1):11130. doi: 10.1038/s41598-021-90491-1. Sci Rep. 2021. PMID: 34045511 Free PMC article.
-
The dynamic epigenetic regulation of the inactive X chromosome in healthy human B cells is dysregulated in lupus patients.Proc Natl Acad Sci U S A. 2021 Jun 15;118(24):e2024624118. doi: 10.1073/pnas.2024624118. Proc Natl Acad Sci U S A. 2021. PMID: 34103397 Free PMC article.
-
Understanding immunopathological fallout of human coronavirus infections including COVID-19: Will they cross the path of rheumatologists?Int J Rheum Dis. 2020 Aug;23(8):998-1008. doi: 10.1111/1756-185X.13909. Epub 2020 Aug 10. Int J Rheum Dis. 2020. PMID: 32779341 Free PMC article. Review.
-
BIRD: identifying cell doublets via biallelic expression from single cells.Bioinformatics. 2020 Jul 1;36(Suppl_1):i251-i257. doi: 10.1093/bioinformatics/btaa474. Bioinformatics. 2020. PMID: 32657402 Free PMC article.
References
Publication types
MeSH terms
Grants and funding
- R01 DA006227/DA/NIDA NIH HHS/United States
- R01 MH101782/MH/NIMH NIH HHS/United States
- R01 MH101810/MH/NIMH NIH HHS/United States
- R01 MH101819/MH/NIMH NIH HHS/United States
- R01 DA033684/DA/NIDA NIH HHS/United States
- R01 MH090936/MH/NIMH NIH HHS/United States
- HHSN261200800001C/CA/NCI NIH HHS/United States
- T15 LM007033/LM/NLM NIH HHS/United States
- R01 MH090951/MH/NIMH NIH HHS/United States
- T32 HG000044/HG/NHGRI NIH HHS/United States
- R01 MH101822/MH/NIMH NIH HHS/United States
- F32 GM115208/GM/NIGMS NIH HHS/United States
- U01 HG007610/HG/NHGRI NIH HHS/United States
- P30 DK043351/DK/NIDDK NIH HHS/United States
- U54 DK105566/DK/NIDDK NIH HHS/United States
- R01 MH101820/MH/NIMH NIH HHS/United States
- R01 MH101825/MH/NIMH NIH HHS/United States
- R01 MH090948/MH/NIMH NIH HHS/United States
- R01 MH090941/MH/NIMH NIH HHS/United States
- R01 MH090937/MH/NIMH NIH HHS/United States
- R01 GM104371/GM/NIGMS NIH HHS/United States
- HHSN268201000029C/HL/NHLBI NIH HHS/United States
- HHSN261200800001E/CA/NCI NIH HHS/United States
- R01 MH101814/MH/NIMH NIH HHS/United States

