Involvement of PPARγ in the Anticonvulsant Activity of EP-80317, a Ghrelin Receptor Antagonist
- PMID: 29018345
- PMCID: PMC5614981
- DOI: 10.3389/fphar.2017.00676
Involvement of PPARγ in the Anticonvulsant Activity of EP-80317, a Ghrelin Receptor Antagonist
Abstract
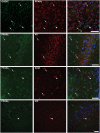
Ghrelin, des-acyl ghrelin and other related peptides possess anticonvulsant activities. Although ghrelin and cognate peptides were shown to physiologically regulate only the ghrelin receptor, some of them were pharmacologically proved to activate the peroxisome proliferator-activated receptor gamma (PPARγ) through stimulation of the scavenger receptor CD36 in macrophages. In our study, we challenged the hypothesis that PPARγ could be involved in the anticonvulsant effects of EP-80317, a ghrelin receptor antagonist. For this purpose, we used the PPARγ antagonist GW9662 to evaluate the modulation of EP-80317 anticonvulsant properties in two different models. Firstly, the anticonvulsant effects of EP-80317 were studied in rats treated with pilocarpine to induce status epilepticus (SE). Secondly, the anticonvulsant activity of EP-80317 was ascertained in the repeated 6-Hz corneal stimulation model in mice. Behavioral and video electrocorticographic (ECoG) analyses were performed in both models. We also characterized levels of immunoreactivity for PPARγ in the hippocampus of 6-Hz corneally stimulated mice. EP-80317 predictably antagonized seizures in both models. Pretreatment with GW9662 counteracted almost all EP-80317 effects both in mice and rats. Only the effects of EP-80317 on power spectra of ECoGs recorded during repeated 6-Hz corneal stimulation were practically unaffected by GW9662 administration. Moreover, GW9662 alone produced a decrease in the latency of tonic-clonic seizures and accelerated the onset of SE in rats. Finally, in the hippocampus of mice treated with EP-80317 we found increased levels of PPARγ immunoreactivity. Overall, these results support the hypothesis that PPARγ is able to modulate seizures and mediates the anticonvulsant effects of EP-80317.
Keywords: 6-Hz corneal stimulation; EP-80317; ghrelin; peroxisome proliferator-activated receptor gamma; pilocarpine; seizure; status epilepticus.
Figures


Similar articles
-
Beneficial effects of desacyl-ghrelin, hexarelin and EP-80317 in models of status epilepticus.Eur J Pharmacol. 2011 Nov 16;670(1):130-6. doi: 10.1016/j.ejphar.2011.08.020. Epub 2011 Sep 2. Eur J Pharmacol. 2011. PMID: 21914437
-
Progressive Seizure Aggravation in the Repeated 6-Hz Corneal Stimulation Model Is Accompanied by Marked Increase in Hippocampal p-ERK1/2 Immunoreactivity in Neurons.Front Cell Neurosci. 2016 Dec 16;10:281. doi: 10.3389/fncel.2016.00281. eCollection 2016. Front Cell Neurosci. 2016. PMID: 28018175 Free PMC article.
-
Des-acyl ghrelin attenuates pilocarpine-induced limbic seizures via the ghrelin receptor and not the orexin pathway.Neuropeptides. 2015 Jun;51:1-7. doi: 10.1016/j.npep.2015.04.004. Epub 2015 May 8. Neuropeptides. 2015. PMID: 26002375
-
Anticonvulsant effect of a ghrelin receptor agonist in 6Hz corneally kindled mice.Epilepsia. 2016 Sep;57(9):e195-9. doi: 10.1111/epi.13463. Epub 2016 Jul 5. Epilepsia. 2016. PMID: 27378373
-
Targeting the Ghrelin Receptor as a Novel Therapeutic Option for Epilepsy.Biomedicines. 2021 Dec 27;10(1):53. doi: 10.3390/biomedicines10010053. Biomedicines. 2021. PMID: 35052733 Free PMC article. Review.
Cited by
-
Antiseizure Effects of Cannabidiol Leading to Increased Peroxisome Proliferator-Activated Receptor Gamma Levels in the Hippocampal CA3 Subfield of Epileptic Rats.Pharmaceuticals (Basel). 2022 Apr 19;15(5):495. doi: 10.3390/ph15050495. Pharmaceuticals (Basel). 2022. PMID: 35631322 Free PMC article.
-
A Hydroxypyrone-Based Inhibitor of Metalloproteinase-12 Displays Neuroprotective Properties in Both Status Epilepticus and Optic Nerve Crush Animal Models.Int J Mol Sci. 2018 Jul 25;19(8):2178. doi: 10.3390/ijms19082178. Int J Mol Sci. 2018. PMID: 30044455 Free PMC article.
-
Protective effect of ghrelin on intestinal I/R injury in rats.Open Med (Wars). 2022 Jul 20;17(1):1308-1317. doi: 10.1515/med-2022-0520. eCollection 2022. Open Med (Wars). 2022. PMID: 35937002 Free PMC article.
-
Therapeutic role of targeting mTOR signaling and neuroinflammation in epilepsy.Epilepsy Res. 2020 Mar;161:106282. doi: 10.1016/j.eplepsyres.2020.106282. Epub 2020 Jan 30. Epilepsy Res. 2020. PMID: 32036255 Free PMC article. Review.
-
Prospective Evaluation of Ghrelin and Des-Acyl Ghrelin Plasma Levels in Children with Newly Diagnosed Epilepsy: Evidence for Reduced Ghrelin-to-Des-Acyl Ghrelin Ratio in Generalized Epilepsies.J Pers Med. 2022 Mar 25;12(4):527. doi: 10.3390/jpm12040527. J Pers Med. 2022. PMID: 35455643 Free PMC article.
References
-
- Adabi Mohazab R., Javadi-Paydar M., Delfan B., Dehpour A. R. (2012). Possible involvement of PPAR-gamma receptor and nitric oxide pathway in the anticonvulsant effect of acute pioglitazone on pentylenetetrazole-induced seizures in mice. Epilepsy Res. 101 28–35. 10.1016/j.eplepsyres.2012.02.015 - DOI - PubMed
LinkOut - more resources
Full Text Sources
Other Literature Sources

