. 2017 Nov;24(11):965-976.
doi: 10.1038/nsmb.3482. Epub 2017 Oct 9.

Architectural alterations of the fission yeast genome during the cell cycle

Affiliations

Architectural alterations of the fission yeast genome during the cell cycle

Hideki Tanizawa et al. Nat Struct Mol Biol. 2017 Nov.

Abstract

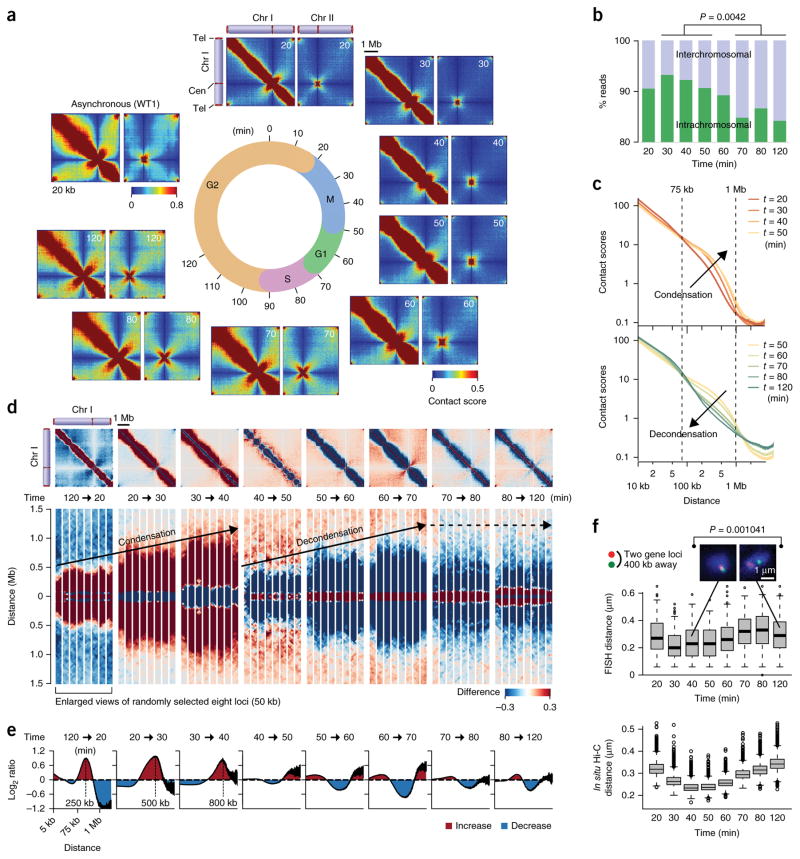
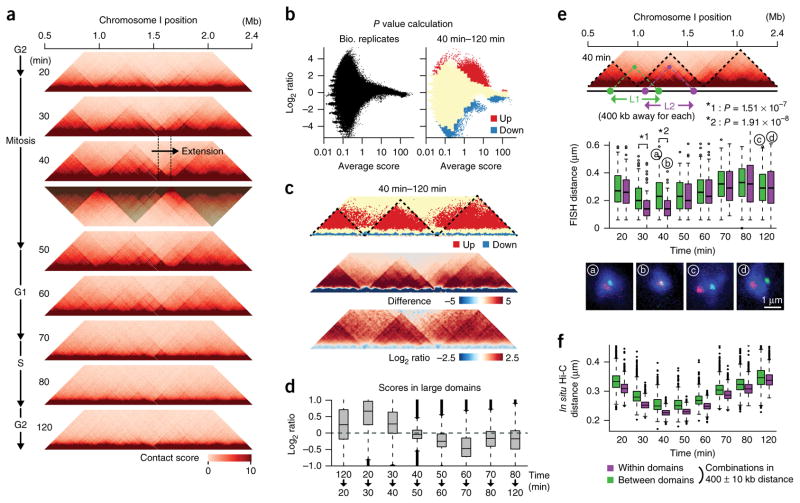
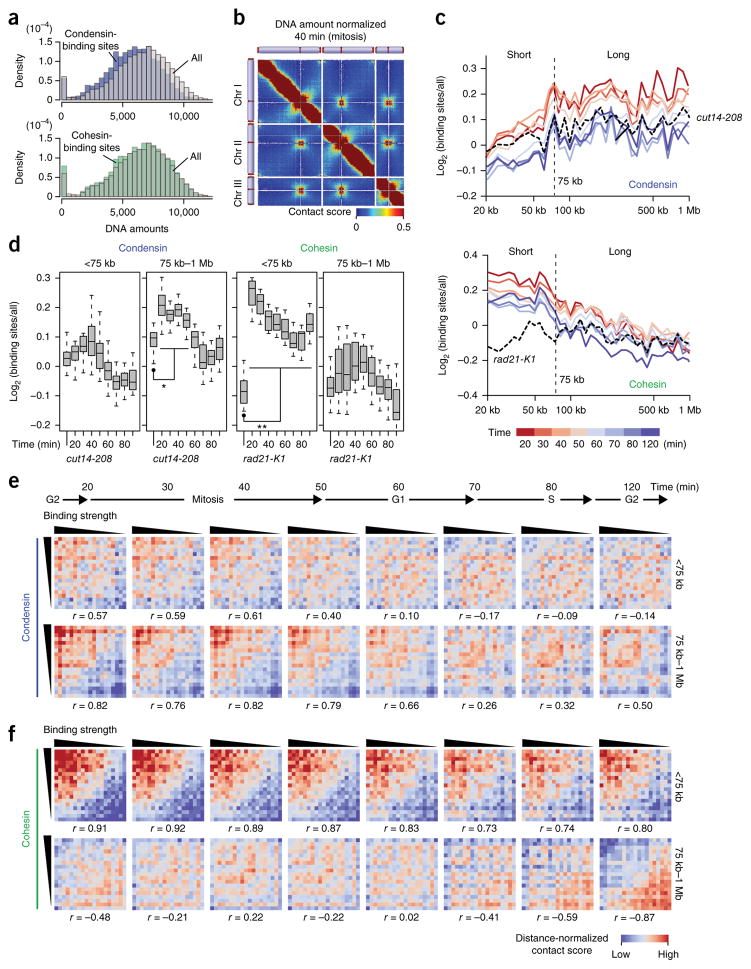
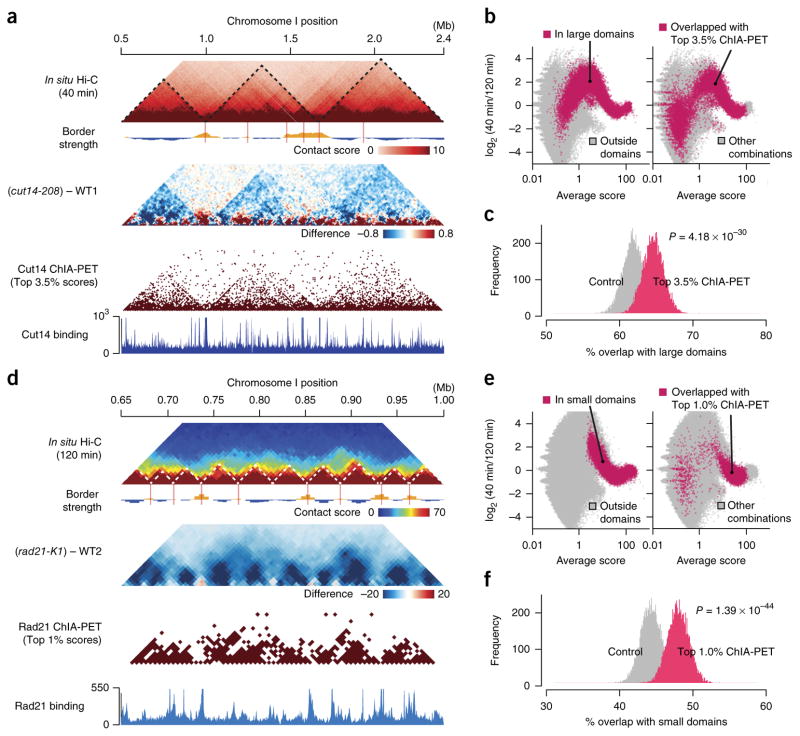
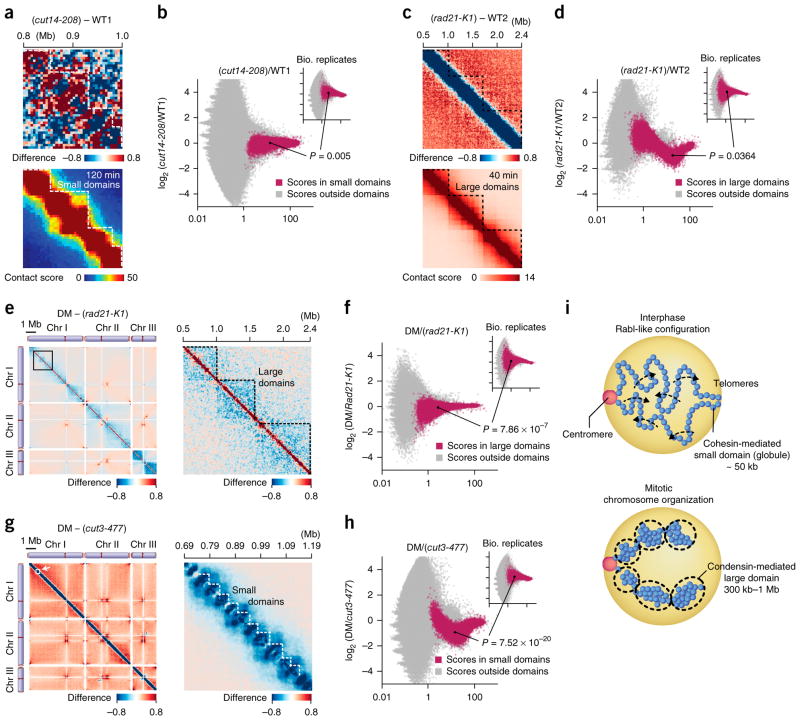
Eukaryotic genomes are highly ordered through various mechanisms, including topologically associating domain (TAD) organization. We employed an in situ Hi-C approach to follow the 3D organization of the fission yeast genome during the cell cycle. We demonstrate that during mitosis, large domains of 300 kb-1 Mb are formed by condensin. This mitotic domain organization does not suddenly dissolve, but gradually diminishes until the next mitosis. By contrast, small domains of 30-40 kb that are formed by cohesin are relatively stable across the cell cycle. Condensin and cohesin mediate long- and short-range contacts, respectively, by bridging their binding sites, thereby forming the large and small domains. These domains are inversely regulated during the cell cycle but assemble independently. Our study describes the chromosomal oscillation between the formation and decay phases of the large and small domains, and we predict that the condensin-mediated domains serve as chromosomal compaction units.


Conflict of interest statement

COMPETING FINANCIAL INTERESTS

The authors declare no competing financial interests.

Figures

Figure 1
Figure 1
Genomic architecture changes throughout the fission yeast cell cycle. (a) Intra- (chromosome I) and interchromosomal (chromosomes I and II) contact maps during the cell cycle. (b) Percentages of in situ Hi-C reads representing inter- and intrachromosomal contacts. Read numbers reflecting interchromosomal contacts during M phase (30-, 40-, and 50-min points) and during interphase (70-, 80-, and 120-min points) were subjected to two-sided Student’s t test. (c) Relations between contact scores and genomic distances. Contact scores between gene loci separated by the same distances were used to calculate average scores, which were plotted against distance. (d) Difference of contact scores between two consecutive time points. Red and blue dots indicate that contact scores are increased and decreased, respectively, upon cell-cycle progression between the indicated time points. Bottom panels show enlarged views of eight randomly selected loci (50 kb). (e) Average log2 ratios of contact scores between two consecutive time points. Average log2 ratios were calculated for every two loci separated by same distances and plotted against distance. (f) FISH analysis covisualizing the two gene loci during the cell cycle. The two loci are located 400 kb apart. Distance between two FISH foci was measured in more than 100 cells at the indicated time points. Representative images are shown on top (n = 108 and n = 132 for 40- and 120-min time points, respectively). Boxplots show center quartiles, midlines show medians and whiskers extend to the data points, which are no more than 1.5× the interquartile range from the box. Circles indicate outliers. Bottom, contact scores between every two loci located 400 kb apart were converted to physical distances using the conversion formula obtained by comparing contact scores and FISH data (Supplementary Fig. 2e). Physical distances estimated from contact scores were plotted as boxplots defined as above at the respective time points. Source data for f are available in Supplementary Data Sets 1 and 2.
Figure 2
Figure 2
Regulation of large domains during the cell cycle. (a) Contact maps for the 1.9-Mb area at the indicated time points. Domains (shaded) were defined at the 40-min time point as described in Supplementary Figure 6. (b) Detection of significantly altered contacts. Averages and log2 ratios of contact scores between two in situ Hi-C experiments using independent cell cultures (120-min point) and between the 40- and 120-min time points were plotted. Significantly upregulated (red) and downregulated (blue) genomic contacts were defined using the variation of contact scores between the biological replicates (Online Methods). (c) Significantly upregulated (red) and downregulated (blue) contacts were plotted along the same area as in a (top). Dotted lines indicate the large domains. Difference (middle) and log2 ratios (bottom) of contact scores between the 40- and 120-min time points were also plotted for the same area. (d) Log2 ratios of contact scores between the indicated consecutive time points were calculated for all genomic contacts within the large domains and represented as boxplots. Source data for d are available in Supplementary Data Set 3. (e) FISH validation. The L1 and L2 paired gene loci located 400 kb apart were examined using FISH during the cell cycle. The distance between two FISH foci was measured in more than 100 cells during the cell cycle, and distances between the paired loci were plotted as boxplots at the indicated time points. Green and purple boxes indicate L1 and L2 data, respectively. Representative FISH images (denoted a–d) are shown below (n = 108, 103, 132 and 125 for a, b, c and d, respectively). Source data for L2 are available in Supplementary Data Set 1 and for L1 in Supplementary Data Set 4. (f) Every set of paired loci separated by 400 kb were divided to the two categories, in which they are located either within (purple) or between (green) the large domains. Contact scores from the two categories were converted to physical distances (see Fig. 1f), which were plotted as boxplots. Source data for f are available in Supplementary Data Set 5. All boxplot edges show center quartiles, midlines show medians, and whiskers extend to the data points, which are no more than 1.5× the interquartile range from the box. Circles indicate outliers.
Figure 3
Figure 3
Organization of small domains across the cell cycle. (a) Contact maps for the 500-kb genomic region during the cell cycle. Positive border strength scores were defined as borders (red lines). Dotted lines represent the conserved domains across the cell cycle. (b) Domain sizes during the cell cycle. Numbers of the predicted small domains are shown at top. Domain sizes are represented as boxplots. Source data for b are available in Supplementary Data Set 6. (c) Log2 ratios of contact scores between the indicated consecutive time points were calculated for all genomic contacts within the small domains and represented as boxplots. Source data for c are available in Supplementary Data Set 7. (d) Correlations between contact maps were evaluated using the HiCRep program. Note that genomic contacts were divided into three categories (<75 kb, 75 kb–1 Mb, and >1 Mb) on the basis of distances between two loci and that correlations were calculated for the respective categories. For b and c, all boxplot edges show center quartiles, midlines show medians, and whiskers extend to the data points, which are no more than 1.5× the interquartile range from the box. Circles indicate outliers.
Figure 4
Figure 4
Effects of condensin and cohesin mutations on domain organizations. (a) Contact maps in the wild-type (WT1) and cut14-208 condensin mutant. (b) Relations between contact scores and genomic distances in WT1 and cut14-208 cells. Dotted lines show the fitting lines against the slopes in the 75–800-kb and >800-kb ranges. (c) Log2 ratios of contact scores between cut14-208 and WT1 cells plotted against distance. (d) Map showing difference of contact scores between cut14-208 and WT1. (e) Enlarged difference map for the 1.9-Mb area indicated by the open box in d. Dotted lines indicate the large domains. (f) Enlarged contact map at the 40-min time point. (g) Averages and log2 ratios of contact scores between the cut14-208 mutant and WT1 and between two in situ Hi-C experiments using independent cell cultures (120-min point; inset). Genomic contacts within the large domains (red) were separated from other contacts (gray) and were used in the analysis. 100 combinations of genomic loci were randomly selected from the large domains. Log2 ratios of contact scores between the cut14-208 mutant and WT1 and between the biological replicates (120-min point) were extracted for the selected 100 combinations and subjected to two-sided paired Student’s t test. Random sampling was repeated 1,000 times and a median of P values is represented. (h) A contact map in the rad21-K1 cohesin mutant. (i) A map showing difference of contact scores between the rad21-K1 mutant and WT2. (j) Relations between contact scores and genomic distances in the WT2 and rad21-K1 mutant. Dotted lines show the fitting lines against the slopes in the <75-kb and >75-kb ranges. (k) Contact maps for the 500-kb region indicated by the open box in i in rad21-K1 (left) and WT2 cells (right). Dotted lines indicate the small domains. (l) Enlarged difference map between the rad21-K1 and WT2 for the same 500 kb-region. (m) Averages and log2 ratios of contact scores between the rad21-K1 mutant and WT2 and between two in situ Hi-C experiments using independent cell cultures (120-min point; inset). The rad21-K1 and WT2 small domains were subjected to the same statistical analyses as described in g.
Figure 5
Figure 5
Condensin- and cohesin-binding sites mediate long- and short-range contacts, respectively. (a) The DNA amounts of condensin-binding sites (n = 485; top) and cohesin-binding sites (n = 475; bottom) were compared to the distribution of every locus. DNA amounts of respective gene loci were estimated based on the distribution of sequenced reads derived from self-ligation and undigested products (Online Methods). (b) A contact map after DNA-amount normalization (Online Methods). (c) The in situ Hi-C data from the different cell-cycle stages and cut14-208 condensin mutant were subjected to DNA-amount normalization. Average contact scores between condensin-binding sites (5-kb bins) separated by same distances were divided by distance-conserved average contact scores estimated from every bin. Their log2 ratios were plotted against distance (top). The same analysis was performed for cohesin-binding sites and with the rad21-K1 cohesin mutant (bottom). (d) Distributions of log2 scores in c are separately summarized for the <75-kb and 75 kb–1 Mb distances. P values were calculated using two-sided paired Student’s t test (n = 13 and 26 for <75 kb and 75 kb–1 Mb, respectively). Asterisk (*) indicates that log2 scores at each time point were significantly different from those of the cut14-208 (P values = 2.20 × 10⁻⁵ (20 min), 5.09 × 10⁻⁷ (30 min), 8.70 × 10⁻⁶ (40 min)). Double asterisk (**) indicates that log2 scores across the cell cycle were significantly different from those of the rad21-K1 (P values = 7.82 × 10⁻⁵ (20 min), 0.000153 (30 min), 0.000182 (40 min), 0.000193 (50 min), 0.000560 (60 min), 0.00119 (70 min), 0.00161 (80 min), 0.000953 (120 min)). Boxplot edges show center quartiles, midlines show medians, and whiskers extend to the data points, which are no more than 1.5× the interquartile range from the box. Source data for d are available in Supplementary Data Set 8. (e) Condensin binding strength versus distance-dependent contacts. Binding strength and distance-normalized contact scores were subjected to the Pearson’s correlation (r) calculation (Online Methods). (f) Cohesin binding strength versus distance-dependent contacts, subjected to same statistical analyses as described in e.
Figure 6
Figure 6
Comparison between the in situ Hi-C and ChIA-PET data (a) In situ Hi-C data were compared to the Cut14 condensin ChIA-PET data. Maps for the 1.9-Mb region show contact scores at the 40-min time point (mid M; top) and difference of contact scores between the cut14-208 mutant and WT1 (second). The ChIA-PET data were analyzed using the same procedure applied to the in situ Hi-C data (Supplementary Fig. 1b). The top 3.5% of condensin-mediated contacts were extracted from the ChIA-PET data and plotted (third). Based on the ChIA-PET data, condensin enrichment and binding sites were predicted (bottom) as described in ref. . (b) Averages and log2 ratios of contact scores between the 40- and 120-min points were plotted for genomic contacts within (red) and outside (gray) the large domains (left). The same data were annotated differently for genomic contacts that overlapped with the top 3.5% condensin-mediated contacts (red) and others (gray) (right). (c) The top 3.5% of condensin-mediated contacts predicted from the ChIA-PET data were frequently positioned within the large domains (Online Methods). 1,000 genomic contacts were randomly selected from the top 3.5% of condensin ChIP-PET combinations. Genomic contacts with the same distances were randomly selected for distance-conserved random sampling from every combination. This sampling was repeated 10,000 times, and distributions of % overlap with the large domains were plotted. For P value calculation, the same sampling was repeated 100 times, and distributions of % overlap scores were subjected to one-sided Student’s t test. (d) The in situ Hi-C data were compared to the Rad21 cohesin ChIA-PET data. Based on the ChIA-PET data, cohesin enrichment and binding sites were predicted (bottom) as described in ref. . (e) Averages and log2 ratios of contact scores between the 40- and 120-min time points were plotted for genomic contacts within (red) and outside (gray) the small domains (left). The same data were differently annotated for genomic contacts that overlapped with the top 1% of cohesin-mediated contacts (red) and others (gray) (right). (f) The top 1% of cohesin-mediated contacts predicted from the ChIA-PET data were often located within the small domains. The same analysis as described in c was performed for the cohesin-mediated contacts and the small domains.
Figure 7
Figure 7
Independence between condensin- and cohesin-mediated domain organizations. (a) Difference of contact scores between the cut14-208 mutant and WT1 (top). The bottom panel represents the 120-min contact map. (b) Averages and log2 ratios of contact scores between the cut14-208 mutant and WT1 and between two in situ Hi-C experiments using independent cell cultures (120-min point; inset) were plotted. Genomic contacts within the small domains (red) were separated from other contacts (gray) and were used in the analysis. 100 combinations of genomic loci were randomly selected from the small domains. Log2 ratios of contact scores between the cut14-208 mutant and WT1 and between the biological replicas (120-min point) were extracted for the selected 100 combinations and subjected to two-sided paired Student’s t test. Random sampling was repeated 1,000 times and a median of P values is shown. (c) Difference of contact scores between the rad21-K1 mutant and WT2 (top). The bottom panel represents the 40-min contact map. (d) Averages and log2 ratios of contact scores between the rad21-K1 mutant and WT2 and between two in situ Hi-C experiments using independent cell cultures (120-min point; inset) were plotted. The same analysis described in b was performed with the rad21-K1 for the large domains. (e) Left, difference of contact scores between the cut3-477 rad21-K1 condensin–cohesin double mutant (DM) and the rad21-K1 single mutant. Right, enlargement of the genomic region marked by the open box in left panel. (f) Averages and log2 ratios of contact scores between the DM and rad21-K1 mutant and between two in situ Hi-C experiments using independent cell cultures (120-min point; inset) were plotted. The same analysis described in b was performed with the DM and rad21-K1 for the large domains. (g) Left, difference of contact scores between the DM and cut3-477 condensin single mutant. Right, enlargement of the genomic region indicated by the open box in left panel. (h) Averages and log2 ratios of contact scores between the DM and cut3-477 mutant and between two in situ Hi-C experiments using independent cell cultures (120-min point; inset) were plotted. The same analysis as described in b was performed with the DM and cut3-477 for the small domains. (i) A model explaining how the condensin- and cohesin-mediated contact domains are regulated during the cell cycle (see Discussion for details).

Similar articles

Cited by

References

    1. Lieberman-Aiden E, et al. Comprehensive mapping of long-range interactions reveals folding principles of the human genome. Science. 2009;326:289–293. - PMC - PubMed
    1. Fullwood MJ, et al. An oestrogen-receptor-alpha-bound human chromatin interactome. Nature. 2009;462:58–64. - PMC - PubMed
    1. Dekker J, Misteli T. Long-range chromatin interactions. Cold Spring Harb Perspect Biol. 2015;7:a019356. - PMC - PubMed
    1. Phillips-Cremins JE, et al. Architectural protein subclasses shape 3D organization of genomes during lineage commitment. Cell. 2013;153:1281–1295. - PMC - PubMed
    1. Dowen JM, et al. Control of cell identity genes occurs in insulated neighborhoods in mammalian chromosomes. Cell. 2014;159:374–387. - PMC - PubMed

MeSH terms