. 2017 Oct 19;171(3):683-695.e18.
doi: 10.1016/j.cell.2017.09.017. Epub 2017 Oct 5.

EGFR Ligands Differentially Stabilize Receptor Dimers to Specify Signaling Kinetics

Affiliations

EGFR Ligands Differentially Stabilize Receptor Dimers to Specify Signaling Kinetics

Daniel M Freed et al. Cell. .

Abstract

Epidermal growth factor receptor (EGFR) regulates many crucial cellular programs, with seven different activating ligands shaping cell signaling in distinct ways. Using crystallography and other approaches, we show how the EGFR ligands epiregulin (EREG) and epigen (EPGN) stabilize different dimeric conformations of the EGFR extracellular region. As a consequence, EREG or EPGN induce less stable EGFR dimers than EGF-making them partial agonists of EGFR dimerization. Unexpectedly, this weakened dimerization elicits more sustained EGFR signaling than seen with EGF, provoking responses in breast cancer cells associated with differentiation rather than proliferation. Our results reveal how responses to different EGFR ligands are defined by receptor dimerization strength and signaling dynamics. These findings have broad implications for understanding receptor tyrosine kinase (RTK) signaling specificity. Our results also suggest parallels between partial and/or biased agonism in RTKs and G-protein-coupled receptors, as well as new therapeutic opportunities for correcting RTK signaling output.

Keywords: biased agonist; cell fate decision; crystallography; dimerization; growth factor; kinetic proofreading; negative feedback; phosphatase; receptor tyrosine kinase; signaling specificity.


Figures

Figure 1
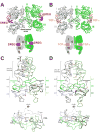
Figure 1. Epiregulin induces asymmetric sEGFR dimmers
Distinct sEGFR501 dimer structures induced by (A) EREG and (B) TGFα (PDB ID 1MOX), aligned using the left (grey) protomer. Asymmetry of the EREG/sEGFR501 complex is emphasized in the lower cartoons, depicting ‘bent’ and ‘straight’ domain II configurations with white dashed lines. Close-up of domain II dimer interfaces induced by (C) EREG and (D) TGFα viewed from the side (upper) and bottom (lower). In (C), the side view shows a 7 Å upward shift of the green receptor (right) relative to the grey receptor (left) in the EREG/sEGFR501 complex. C-terminal disulfide-bonded modules in each domain II are colored different shades of grey or green, with selected interface residues labeled – in bold when involved directly in interactions. The arrow on the right of (C) denotes an outward shift of the grey dimerization arm (including Y251) that prevents Y251/R285 contacts. Asterisk in (D) marks key ‘buttressed’ intermolecular contacts involving D279 and H280. See also Figure S1 and Table S1.
Figure 2
Figure 2. Epigen-bound sEGFR is monomeric
(A) Ribbon structure of EPGN-bound sEGFR501, with sEGFR501 colored red and EPGN cyan. (B) Structure of sErbB2 (residues 1-509 – analogous to sEGFR501) in the same orientation asin (A), from PDB ID 2A91. See also Figures S2 and S3, and Table S1.
Figure 3
Figure 3. Distinct sEGFR domain II conformations for EREG and EPGN
, (A) EPGN-bound sEGFR501 (red) overlays well with the right-hand (green) molecule of the EREG/sEGFR501 dimer, but deviates significantly (B) when overlaid on the left-hand (grey) molecule. Areas of significant divergence are highlighted with black arrows. (C) EPGN-bound sEGFR501 (red) overlays well with the unliganded Drosophila EGFR extracellular region (s-dEGFR), shown in orange/brown, and sErbB2(1-509) shown in dark blue. The right-hand (green) molecule of the EREG/sEGFR501 dimer also falls into this category. Domain II is unbent in each of these structures, as depicted by the straight black dashed line. (D) The left-hand (grey) molecule of the asymmetric EREG/sEGFR501 dimer overlays well with both TGFα-bound sEGFR501, shown in gold and the NRG1β-bound ErbB4 extracellular region (sErbB4) from PDB ID 3U7U, shown in black (Liu et al., 2012). The domain II dimerization interface is distinctly bent in each of these dimerization-competent structures, as depicted by the curved black dashed line and interactions with the space-filling sEGFR501 model (from the TGFα/sEGFR501 dimer) shown at right. See also Figure S3.
Figure 4
Figure 4. EGFR dimerization and activation by different ligands
(A) SAXS-derived normalized I(0)/c values for 70 μM sEGFR501 without ligand (white bar) or with saturating concentrations (84 μM) of EGFR ligands (colored bars). I(0)/c values represent fold increases over that seen for sEGFR501 monomers. Hatched bars represent data for dimerization arm-mutated (dimarm*) sEGFR501. Values of the mean (± SD) and n are presented. Representative Guinier regions for each biological replicate are plotted in Figure S4. (B) Activation of human EGFR in stable Drosophila S2 cell lines expressing wild-type human EGFR or the dimarm* variant, stimulated with EREG (upper), EPGN (lower), or 100 nM EGF as positive control. Each experiment represents three biological repeats. (C) LI-COR quantitation for data from three biological repeats (± SD) of the experiment shown in (B). See also Figure S4.
Figure 5
Figure 5. Epiregulin and epigen induce weaker and shorter-lived EGFR dimers than EGF
(A) Cartoon of quantitative FRET experiments. (B, C) Quantitative EGFRECR-TM-eYFP/EGFRECR-TM-mCherry FRET data (see Methods) for EREG (B) and EPGN (C) at 1 μM (open circles) or 20 μM (closed circles), plotted as a function of receptor density. FRET with no ligand (grey open circles) or with saturating (100 nM) EGF (black circles) is plotted for comparison. Standard error is plotted in the y-axis and standard deviation in the x-axis, for binned data. Best-fit curves of unbinned data to the dimerization model described in Methods are plotted (see Table S2). (D, E) Single particle tracking of HA-tagged full-length EGFR in CHO cells. Diffusion of quantum dot-labeled EGFRs was monitored without ligand (grey), or with saturating EGF (50 nM), EREG (20 μM) or EPGN (20 μM). Ensemble mean square displacement (MSD) is plotted for N > 1834 trajectories per condition (D), and diffusion coefficient distribution across cells is plotted for N > 61 cells per condition (E). The inset in (D) shows MSD at small displacements with shaded areas representing 95% confidence intervals from fits. Distributions in (E) are compared using Welch's t-test (*P= 0.048, **P= 0.006). See also Figure S5 and Table S2.
Figure 6
Figure 6. EGFR activation by epiregulin or epigen is sustained
(A) Representative time-courses of EGFR phosphorylation at Y1173, Y845, and Y1086 in MCF-7 cells induced by saturating levels of EGF (16 nM), EREG (20 μM) or EPGN (20 μM). Anti-Grb2 is used as loading control. Data for pY1173 were generated by stripping and reprobing pY845 blots, so use the same loading controls. (B) Quantitation of EGFR phosphorylation time courses, normalized by signal at 5 minutes. Data are plotted on the same graph for multiple independent experiments quantitating phosphorylation at Y1173 (squares), Y845 (circles) and Y1086 (triangles). See also Figure S6.
Figure 7
Figure 7. Sustained signaling by epiregulin and epigen promotes MCF-7 cell differentiation
(A) Oil Red O staining of MCF-7 cells stimulated with saturating EREG (10 μM), EPGN (10 μM), EGF (16 nM), NRG1b (25 nM), or with no ligand. (B, C) Representative time-courses of Erk phosphorylation (at T202 and Y204) in MCF-7 cells induced by saturating levels of each EGFR ligand. (B) EREG and EPGN were added at 20 μM, and EGF at 16 nM. (C) AREG was added at 20 μM, BTC and HB-EGF at 15 nM, and TGFα at 25 nM. (D) Representative time courses of Akt S473 phosphorylation in MCF-7 cells after treatment with EREG (20 μM), EPGN (20 μM), of EGF (16 nM). See also Figure S7.

Similar articles

Cited by

References

    1. Adams PD, Afonine PV, Bunkoczi G, Chen VB, Davis IW, Echols N, Headd JJ, Hung LW, Kapral GJ, Grosse-Kunstleve RW, et al. PHENIX: a comprehensive Python-based system for macromolecular structure solution. Acta Crystallogr D Biol Crystallogr. 2010;66:213–221. - PMC - PubMed
    1. Aksamitiene E, Hoek JB, Kiyatkin A. Multistrip Western blotting: a tool for comparative quantitative analysis of multiple proteins. Methods Mol Biol. 2015;1312:197–226. - PubMed
    1. Alvarado D, Klein DE, Lemmon MA. ErbB2 resembles an autoinhibited invertebrate epidermal growth factor receptor. Nature. 2009;461:287–291. - PMC - PubMed
    1. Alvarado D, Klein DE, Lemmon MA. Structural basis for negative cooperativity in growth factor binding to an EGF receptor. Cell. 2010;142:568–579. - PMC - PubMed
    1. Bessman NJ, Bagchi A, Ferguson KM, Lemmon MA. Complex relationship between ligand binding and dimerization in the epidermal growth factor receptor. Cell Rep. 2014;9:1306–1317. - PMC - PubMed