

Objectively Measured Physical Activity, Sedentary Behavior, and Genetic Predisposition to Obesity in U.S. Hispanics/Latinos: Results From the Hispanic Community Health Study/Study of Latinos (HCHS/SOL)
- PMID: 28986399
- PMCID: PMC5697950
- DOI: 10.2337/db17-0573
Objectively Measured Physical Activity, Sedentary Behavior, and Genetic Predisposition to Obesity in U.S. Hispanics/Latinos: Results From the Hispanic Community Health Study/Study of Latinos (HCHS/SOL)
Abstract
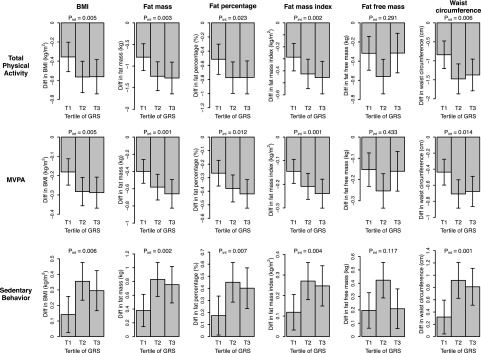
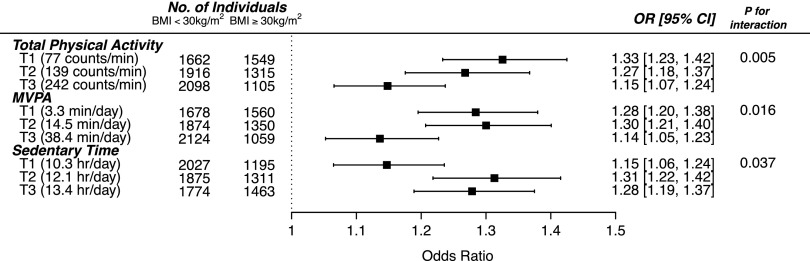
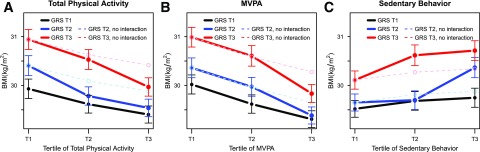
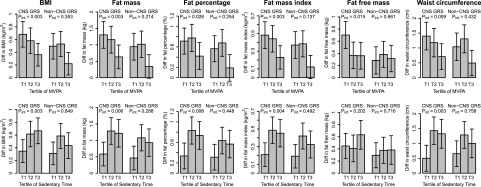
Studies using self-reported data suggest a gene-physical activity interaction on obesity, yet the influence of sedentary behavior, distinct from a lack of physical activity, on genetic associations with obesity remains unclear. We analyzed interactions of accelerometer-measured moderate to vigorous physical activity (MVPA) and time spent sedentary with genetic variants on obesity among 9,645 U.S. Hispanics/Latinos. An overall genetic risk score (GRS), a central nervous system (CNS)-related GRS, and a non-CNS-related GRS were calculated based on 97 BMI-associated single nucleotide polymorphisms (SNPs). Genetic association with BMI was stronger in individuals with lower MVPA (first tertile) versus higher MVPA (third tertile) (β = 0.78 kg/m2 [SE, 0.10 kg/m2] vs. 0.39 kg/m2 [0.09 kg/m2] per SD increment of GRS; Pinteraction = 0.005), and in those with more time spent sedentary (third tertile) versus less time spent sedentary (first tertile) (β = 0.73 kg/m2 [SE, 0.10 kg/m2] vs. 0.44 kg/m2 [0.09 kg/m2]; Pinteraction = 0.006). Similar significant interaction patterns were observed for obesity risk, body fat mass, fat percentage, fat mass index, and waist circumference, but not for fat-free mass. The CNS-related GRS, but not the non-CNS-related GRS, showed significant interactions with MVPA and sedentary behavior, with effects on BMI and other adiposity traits. Our data suggest that both increasing physical activity and reducing sedentary behavior may attenuate genetic associations with obesity, although the independence of these interaction effects needs to be investigated further.
© 2017 by the American Diabetes Association.
Figures
Similar articles
-
Relevance of Physical Activities, Sedentary Behaviors, and Genetic Predisposition in Body Fatness: Population-Based Study on Chinese Adults.Obes Facts. 2021;14(4):346-356. doi: 10.1159/000515380. Epub 2021 Jul 9. Obes Facts. 2021. PMID: 34247171 Free PMC article.
-
Do physical activity, commuting mode, cardiorespiratory fitness and sedentary behaviours modify the genetic predisposition to higher BMI? Findings from a UK Biobank study.Int J Obes (Lond). 2019 Aug;43(8):1526-1538. doi: 10.1038/s41366-019-0381-5. Epub 2019 Jun 5. Int J Obes (Lond). 2019. PMID: 31168053
-
Is there a relationship between accelerometer-assessed physical activity and sedentary behavior and cognitive function in US Hispanic/Latino adults? The Hispanic Community Health Study/Study of Latinos (HCHS/SOL).Prev Med. 2017 Oct;103:43-48. doi: 10.1016/j.ypmed.2017.07.024. Epub 2017 Jul 29. Prev Med. 2017. PMID: 28765082 Free PMC article.
-
Objectively Measured Sedentary Time and Cardiometabolic Biomarkers in US Hispanic/Latino Adults: The Hispanic Community Health Study/Study of Latinos (HCHS/SOL).Circulation. 2015 Oct 20;132(16):1560-9. doi: 10.1161/CIRCULATIONAHA.115.016938. Epub 2015 Sep 28. Circulation. 2015. PMID: 26416808 Free PMC article.
-
Genetic predisposition to adiposity is associated with increased objectively assessed sedentary time in young children.Int J Obes (Lond). 2018 Jan;42(1):111-114. doi: 10.1038/ijo.2017.235. Epub 2017 Sep 26. Int J Obes (Lond). 2018. PMID: 28947836 Free PMC article.
Cited by
-
Polygenic risk score for obesity and the quality, quantity, and timing of workplace food purchases: A secondary analysis from the ChooseWell 365 randomized trial.PLoS Med. 2020 Jul 21;17(7):e1003219. doi: 10.1371/journal.pmed.1003219. eCollection 2020 Jul. PLoS Med. 2020. PMID: 32692747 Free PMC article. Clinical Trial.
-
Interactions between genetic and lifestyle factors on cardiometabolic disease-related outcomes in Latin American and Caribbean populations: A systematic review.Front Nutr. 2023 Jan 26;10:1067033. doi: 10.3389/fnut.2023.1067033. eCollection 2023. Front Nutr. 2023. PMID: 36776603 Free PMC article.
-
Evaluation of the Predictive Ability, Environmental Regulation and Pharmacogenetics Utility of a BMI-Predisposing Genetic Risk Score during Childhood and Puberty.J Clin Med. 2020 Jun 2;9(6):1705. doi: 10.3390/jcm9061705. J Clin Med. 2020. PMID: 32498346 Free PMC article.
-
Accelerometer-assessed physical activity and incident diabetes in a population covering the adult life span: the Hispanic Community Health Study/Study of Latinos.Am J Clin Nutr. 2020 Nov 11;112(5):1318-1327. doi: 10.1093/ajcn/nqaa232. Am J Clin Nutr. 2020. PMID: 32910816 Free PMC article.
-
Impact of polygenic score for BMI on weight loss effectiveness and genome-wide association analysis.Int J Obes (Lond). 2024 May;48(5):694-701. doi: 10.1038/s41366-024-01470-1. Epub 2024 Jan 24. Int J Obes (Lond). 2024. PMID: 38267484
References
MeSH terms
Grants and funding
- HHSN268201300005C/HL/NHLBI NIH HHS/United States
- T42 OH008672/OH/NIOSH CDC HHS/United States
- N01HC65236/HL/NHLBI NIH HHS/United States
- N01HC65235/HL/NHLBI NIH HHS/United States
- N01HC65234/HL/NHLBI NIH HHS/United States
- P30 DK020541/DK/NIDDK NIH HHS/United States
- P30 DK063491/DK/NIDDK NIH HHS/United States
- N01HC65233/HL/NHLBI NIH HHS/United States
- K01 HL129892/HL/NHLBI NIH HHS/United States
- P30 DK111022/DK/NIDDK NIH HHS/United States
- N01HC65237/HL/NHLBI NIH HHS/United States
- U54 TR000123/TR/NCATS NIH HHS/United States
LinkOut - more resources
Full Text Sources
Other Literature Sources
Medical
