. 2017 Nov 2;45(19):11249-11267.
doi: 10.1093/nar/gkx802.

RUNX2 expression in thyroid and breast cancer requires the cooperation of three non-redundant enhancers under the control of BRD4 and c-JUN

Affiliations

RUNX2 expression in thyroid and breast cancer requires the cooperation of three non-redundant enhancers under the control of BRD4 and c-JUN

Valentina Sancisi et al. Nucleic Acids Res. .

Abstract

Aberrant reactivation of embryonic pathways is a common feature of cancer. RUNX2 is a transcription factor crucial during embryogenesis that is aberrantly reactivated in many tumors, including thyroid and breast cancer, where it promotes aggressiveness and metastatic spreading. Currently, the mechanisms driving RUNX2 expression in cancer are still largely unknown. Here we showed that RUNX2 transcription in thyroid and breast cancer requires the cooperation of three distantly located enhancers (ENHs) brought together by chromatin three-dimensional looping. We showed that BRD4 controls RUNX2 by binding to the newly identified ENHs and we demonstrated that the anti-proliferative effects of bromodomain inhibitors (BETi) is associated with RUNX2 transcriptional repression. We demonstrated that each RUNX2 ENH is potentially controlled by a distinct set of TFs and we identified c-JUN as the principal pivot of this regulatory platform. We also observed that accumulation of genetic mutations within these elements correlates with metastatic behavior in human thyroid tumors. Finally, we identified RAINs, a novel family of ENH-associated long non-coding RNAs, transcribed from the identified RUNX2 regulatory unit. Our data provide a new model to explain how RUNX2 expression is reactivated in thyroid and breast cancer and how cancer-driving signaling pathways converge on the regulation of this gene.


Figures

Figure 1.
Figure 1.
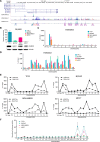
Identification of active ENHs in the RUNX2 locus. (A) Schematic representation of RUNX2 genomic locus showing the position of the two promoters (P1 and P2) and the putative ENHs. Tracks corresponding to the histone modifications used for the identification of the ENHs are displayed. The diagram was obtained by modification of the genome browser view (http://genome.ucsc.edu). (B) qRT-PCR and Western blot analysis of RUNX2 expression in TPC1, BCPAP, MDA-MB231 and MCF7 cell lines. (C–E) ChIP analysis of RUNX2 P2 promoter and ENH3–14 regions with anti-H3K4Me3 (C), anti-H3K4Me1 (D), anti-RNA-PolII and anti-H3K27Ac (E) antibodies in TPC1, BCPAP, MDA-MB231 and MCF7 cells. An unrelated DNA region upstream of the P2 promoter was used as negative control. The bars represent the average enrichment of the indicated genomic regions in the immunoprecipitated DNA expressed as percentage of the input. All data are expressed as mean values ±SEM. N = 3. (F) Luciferase analysis of ENH3–14 regions activity in TPC1, BCPAP, MDA-MB231 and MCF7 cells. Cells were transfected with the indicated pGL3 constructs. The values represent the average fold change of luciferase activity in cells transfected with the pGL3-P2 or pGL3-P2/ENHs vectors, normalized to Renilla luciferase activity for transfection efficiency control and to empty vector activity. All data are expressed as mean values ± SEM. N = 5. For luciferase experiments statistical significance was calculated for each construct containing an ENH fragment compared to the construct containing the P2 promoter alone. ENH3: TPC1 P = 0.02, BCPAP P = 0.04, MDA-MB231 P = 0.01, MCF7 P = 0.006; ENH11.2: TPC1 P = 0.04, BCPAP P = 0.0008, MDA-MB231 P = 0.03, MCF7 P = 0.004; ENH13: TPC1 P = 0.0003, BCPAP P = 0.003, MDA-MB231 P = 0.008, MCF7 P = 0.03.
Figure 2.
Figure 2.
Cooperation between ENH3, ENH11 and ENH13 is required for RUNX2 expression. (A) Chromosome Conformation Capture (3C) of RUNX2 genomic locus. The positions of the RUNX2 P1, P2 and SUPT3H promoters and of the active ENHs are displayed. The interaction frequency for each fragment is expressed as a fraction of the fragment nearest to the anchor. N = 3. ENH3 P = 0.02, ENH10 P = 0.0007, ENH11 P = 0.029, ENH13 P = 0.014. Peak corresponding to region upstream of ENH6 P = 0.06737. (B) Schematic representation of the CRISPR/Cas9 approach employed to generate deletions of the three active ENHs. For each ENH, positions of sgRNAs and extent of deletion are indicated. (C and D) qRT-PCR analysis of RUNX2 (C) and SUPT3H (D) expression in 20 control clones, 9 ENH3 deleted clones, 7 ENH11 deleted clones and 9 ENH13 deleted clones. All data are expressed as mean values ± SEM. * P < 0.05.
Figure 3.
Figure 3.
ENH3, ENH11 and ENH13 are active in human cancer patients. (A) qRT-PCR analysis of RUNX2 expression in normal thyroid and papillary thyroid carcinoma (PTC) tissue of human patients. (B) ChIP analysis of RUNX2 P2 promoter and ENH regions with anti-H3K27Ac antibodies in PTC patients normal or tumoral tissue (N = 14). C) Average number of mutations per patient in RUNX2 promoter and active ENHs in a cohort of 26 papillary thyroid carcinomas that developed distant metastasis (DM-PTCs) and 28 control PTCs that did not develop metastasis (CTRL-PTCs). All the identified mutations were single nucleotide substitutions. Data are expressed as mean values ± SEM. * P < 0.05. (D) Distribution of mutations in the analyzed regions (P2, ENH3, ENH11 and ENH13) in all PTC samples and in the two subgroups (DM-PTC and CTRL-PTC).
Figure 4.
Figure 4.
RUNX2 is a target of BRD4 and of BRD4 inhibitor JQ1. (A) Western blot analysis of BRD4 expression in TPC1, BCPAP, MDA-MB231 and MCF7 cell lines. (B) ChIP analysis of RUNX2 P2 promoter and active ENH regions with anti-BRD4 antibodies in TPC1, BCPAP, MDA-MB231 and MCF7 cells. An unrelated DNA region upstream of the P2 promoter was used as a negative control. The bars represent the average enrichment of the indicated genomic regions in the immunoprecipitated DNA expressed as percentage of the input. (C) Proliferation curve of TPC1, BCPAP, MDA-MB231 and MCF7 cells treated with the indicated concentrations of JQ1 or mock (DMSO). D) qRT-PCR analysis of RUNX2 in TPC1, BCPAP, MDA-MB231 and MCF7 cells treated with the indicated concentrations of JQ1 or mock (DMSO). (E and F) qRT-PCR and Western blot analysis of BRD4 expression in the indicated cells lines treated with siRNA against BRD4 or control siRNA. G) qRT-PCR analysis of RUNX2 expression in the indicated cell lines treated with siRNA against BRD4 or control siRNA. All data are expressed as mean values ± SEM. * P < 0.05. N = 2.
Figure 5.
Figure 5.
BRD4 inhibition modifies chromatin status of RUNX2 locus. (AD) ChIP analysis of RUNX2 P2 promoter and active ENH regions with anti-BRD4 (D), anti- MED1 (E), anti-RNA-PolII (F) or anti-H3K27Ac (G) antibodies in TPC1, BCPAP, MDA-MB231 and MCF7 cells treated with 1 uM JQ1 or mock (DMSO). An unrelated DNA region upstream of the P2 promoter was used as a negative control. The bars represent the average enrichment of the indicated genomic regions in the immunoprecipitated DNA expressed as percentage of the input. All data are expressed as mean values ± SEM. * P < 0.05. N = 3.
Figure 6.
Figure 6.
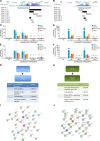
ENH11 and ENH13 respond to distinct signaling pathways. (A and B) Schematic representation of ENH11 (A) and ENH13 (B) genomic loci, showing H3K27Ac binding profile and deletion mutants used in luciferase assay to identify the core of each ENH. The fragments retaining transcriptional activity are displayed in black. (C and F) Luciferase analysis of subsequent rounds of deletion mutants of ENH11 (C-E) and ENH13 (D-F) in TPC1, BCPAP, MDA-MB231 and MCF7 cells. Cells were transfected with the indicated pGL3 constructs. The bars represent the average fold change of luciferase activity in cells transfected with pGL3-P2 or pGL3-P2/ENHs vectors normalized to Renilla luciferase activity for transfection efficiency control, and to empty vector activity. Data are expressed as mean values ± SEM. * P < 0.05. N = 4. (G and H) Workflow diagram of the analysis for the identification of the pathways converging on ENH11(G) and ENH13 (H) cores. (I and J) Protein–protein interaction analysis of the relationships among the TFs predicted to bind ENH11 (I) and ENH13 (J). Pink lines represent experimentally validated interactions, blue lines indicate protein homology.
Figure 7.
Figure 7.
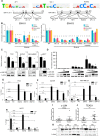
c-JUN is the master regulator of RUNX2 ENHs. (A) Sequence and localization of the predicted TFs binding sites on ENH11 and ENH13 core fragments. Consensus diagram for AP-1, TEF-1 and RUNX2 are reported. (B) Luciferase analysis of the effect of targeted point mutations of the indicated binding sites in the ENH11 and ENH13 core fragments in TPC1, BCPAP, MDA-MB231 and MCF7 cells. Cells were transfected with the indicated pGL3 constructs. The bars represent the average luciferase activity of each mutant construct expressed as a fraction of the WT fragment. Values have been normalized to Renilla luciferase activity as transfection efficiency control. All data are expressed as mean values ± SEM. * P < 0.05. N = 3. (C) qRT-PCR analysis of RUNX2 expression in TPC1, BCPAP, MDA-MB231 and MCF7 cells transfected with an empty vector (NT) or dominant negative c-JUN mutant (c-JUN DN). In each cell line, c-JUN DN expression has been verified by immunoblot with anti-c-JUN antibodies. (D) Luciferase analysis of the P2 promoter, ENH11 and ENH13 cores in TPC1 cells cotransfected with increasing amount of c-JUN DN vector. For each sample c-JUN DN expression has been verified by immunoblot with anti-c-JUN antibodies. Values are representative of two independent experiments. (E–H) ChIP analysis of RUNX2 P2 promoter and active ENH regions with anti-c-JUN antibodies in TPC1 (E), BCPAP (F), MDA-MB231 (G) and MCF7 (H) cells. An unrelated DNA region upstream of the P2 promoter was used as a negative control. The bars represent the average enrichment of the indicated genomic regions in the immunoprecipitated DNA expressed as percentage of the input. All data are expressed as mean values ± SEM. * P < 0.05. N = 3. (I and J) qRT-PCR analysis of c-JUN and TEAD1 expression in normal thyroid and papillary thyroid carcinoma (PTC) tissue of human patients. N = 12. (K) Western Blot analysis for c-JUN in a subset of normal thyroid and PTC samples analyzed by qRT-PCR. Quantification indicates the levels of c-JUN normalized on the Actin levels in normal vs tumor tissues.
Figure 8.
Figure 8.
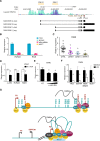
Identification of a novel family of RUNX2 Associated Intergenic Long Non coding RNAs (RAIN). (A) Schematic representation of RAIN isoforms and of the genomic locus from which they are transcribed. Arrows indicate the positions of specific primers used in the RACE experiment. Positions of ENH10 and ENH11 are indicated above the diagram. The variable region of RAINs is indicated in gray. (B) qRT-PCR analysis of the expression of RUNX2 and RAIN transcripts in TPC1, BCPAP, MDA-MB231 and MCF7 cell lines. (C) qRT-PCR analysis of the expression of RAIN in 20 control clones, 9 ENH3 deleted clones, 7 ENH11 deleted clones and 9 ENH13 deleted clones. (D) qRT-PCR analysis of c-JUN, RUNX2 and RAIN expression in TPC1 cells transfected with siRNA oligos against c-JUN or control siRNA. (E) qRT-PCR analysis of the expression of RAIN in TPC1 cells transfected with empty vector (NT) or increasing amounts of a plasmid expressing c-JUN DN. (F) qRT-PCR analysis of RAIN expression in TPC1, BCPAP, MDA-MB231 and MCF7 cells treated with 1 μM JQ1 or mock (DMSO). All expression analysis on RAIN transcripts have been conducted with a common primer pair recognizing all isoforms. All data are expressed as mean values ± SEM. * P < 0.05. N = 3. (G) Schematic representation of RUNX2 ENHs cooperation in controlling RUNX2 P2 promoter.

Similar articles

Cited by

References

    1. Consortium E.P., Bernstein B.E., Birney E., Dunham I., Green E.D., Gunter C., Snyder M.. An integrated encyclopedia of DNA elements in the human genome. Nature. 2012; 489:57–74. - PMC - PubMed
    1. Long H.K., Prescott S.L., Wysocka J.. Ever-changing landscapes: transcriptional enhancers in development and evolution. Cell. 2016; 167:1170–1187. - PMC - PubMed
    1. Li G., Ruan X., Auerbach R.K., Sandhu K.S., Zheng M., Wang P., Poh H.M., Goh Y., Lim J., Zhang J. et al. . Extensive promoter-centered chromatin interactions provide a topological basis for transcription regulation. Cell. 2012; 148:84–98. - PMC - PubMed
    1. Spurrell C.H., Dickel D.E., Visel A.. The ties that bind: mapping the dynamic enhancer-promoter interactome. Cell. 2016; 167:1163–1166. - PMC - PubMed
    1. Pennacchio L.A., Bickmore W., Dean A., Nobrega M.A., Bejerano G.. Enhancers: five essential questions. Nat. Rev. Genet. 2013; 14:288–295. - PMC - PubMed

MeSH terms