. 2017 Jul 7;8(37):62081-62098.
doi: 10.18632/oncotarget.19060. eCollection 2017 Sep 22.

Methyltransferase G9a promotes cervical cancer angiogenesis and decreases patient survival

Affiliations

Methyltransferase G9a promotes cervical cancer angiogenesis and decreases patient survival

Ruey-Jien Chen et al. Oncotarget. .

Abstract

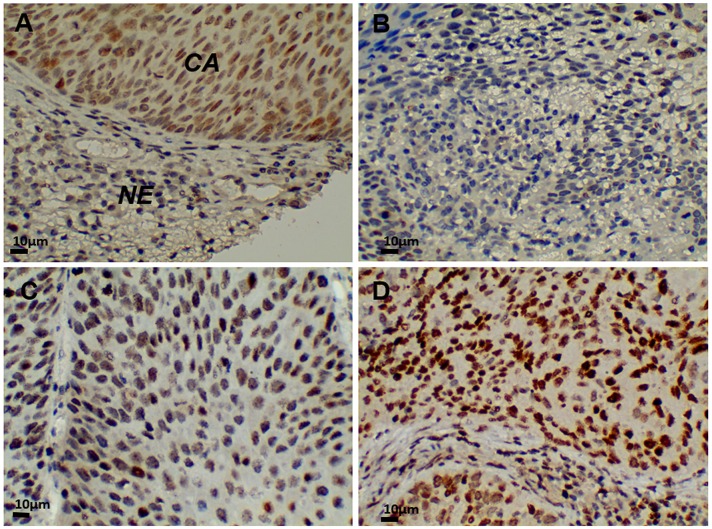
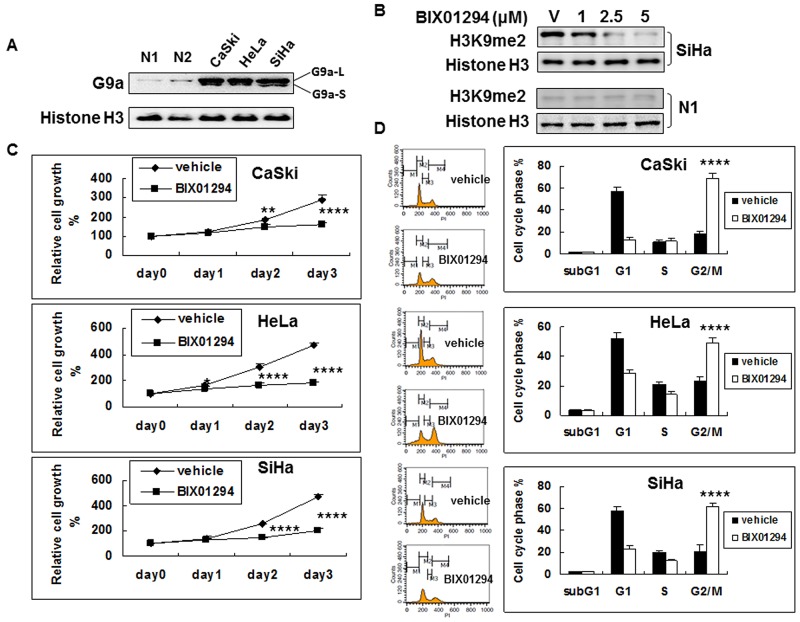
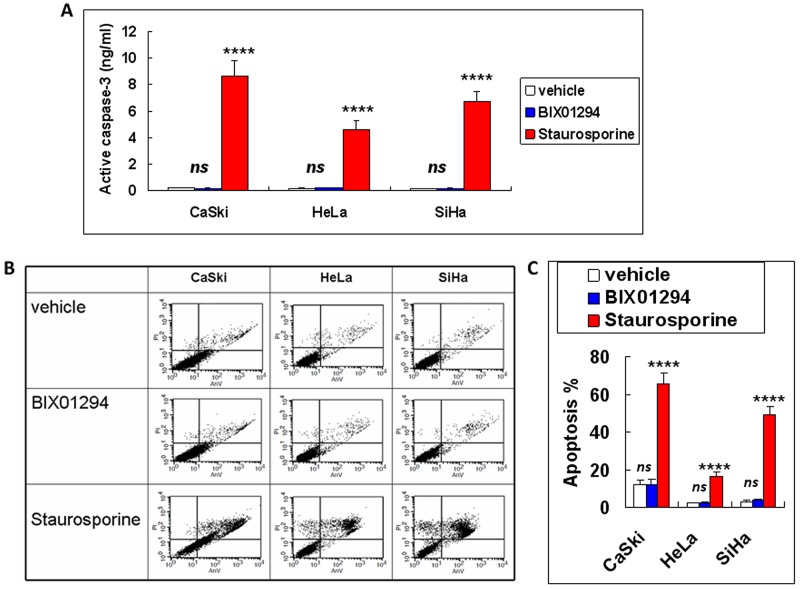
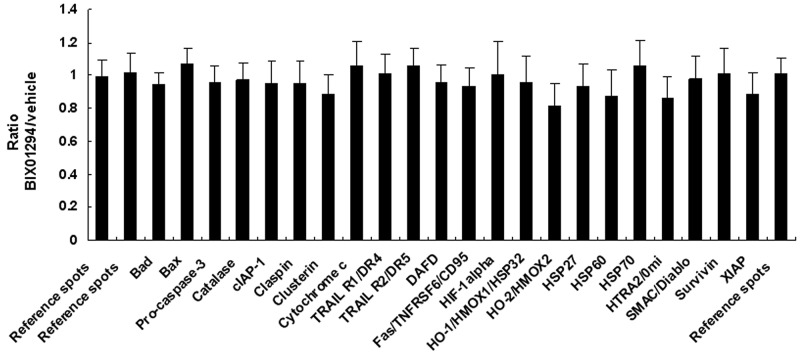
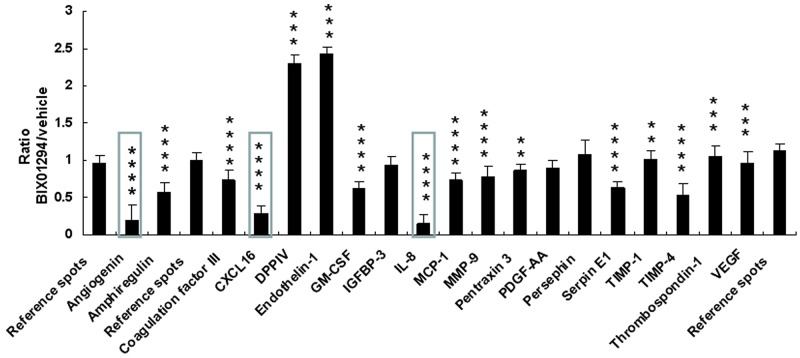
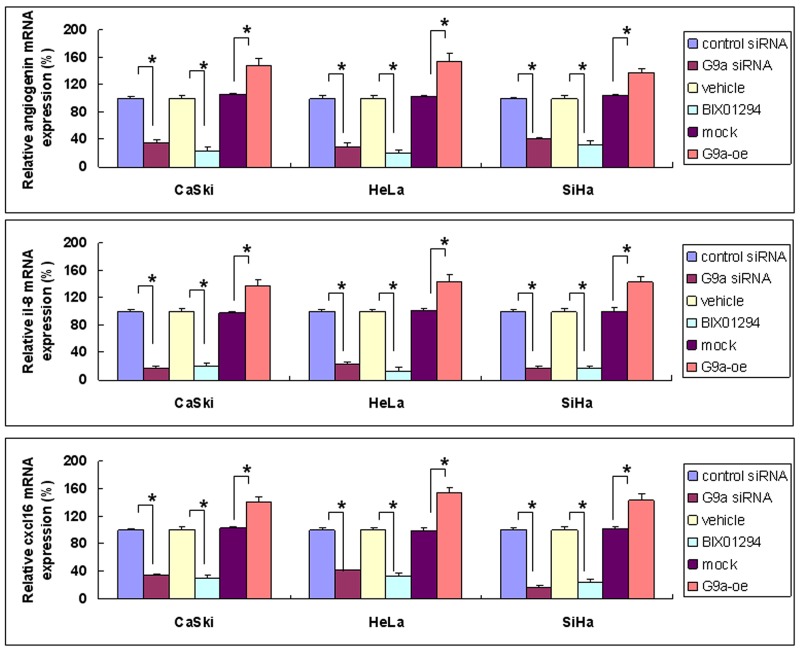
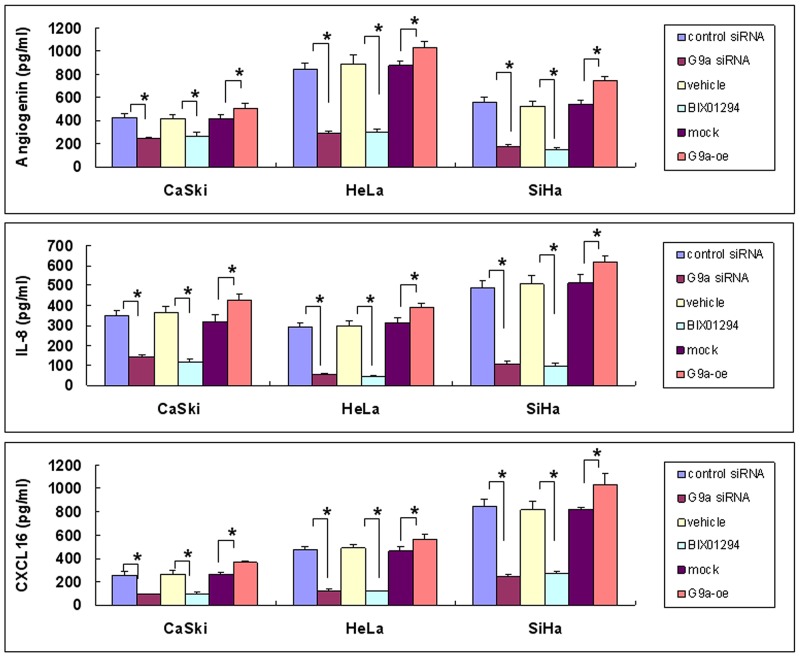
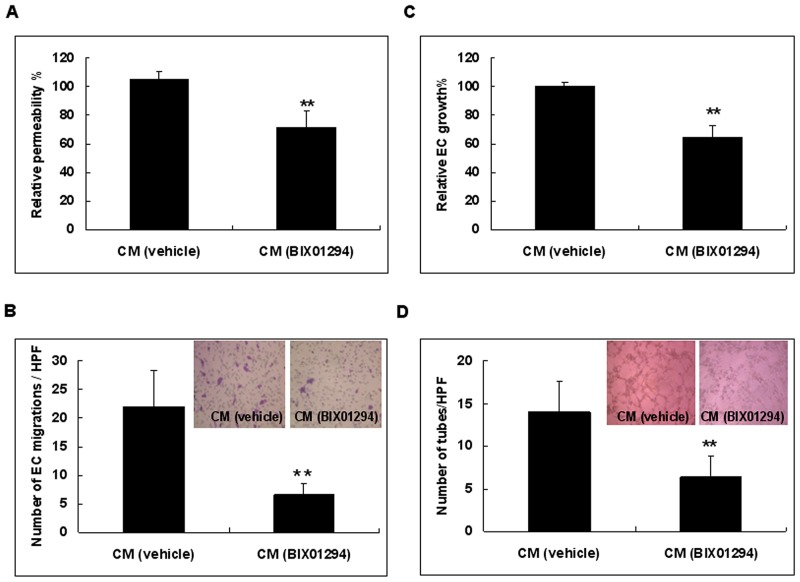
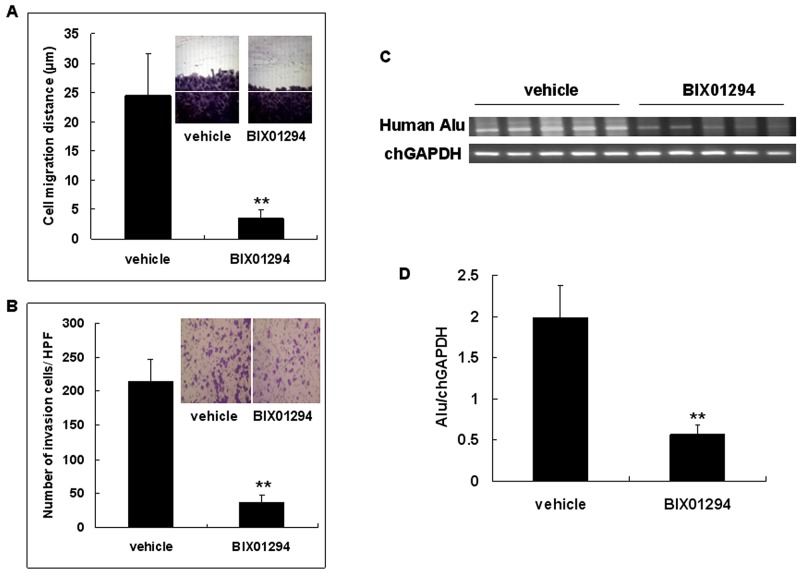
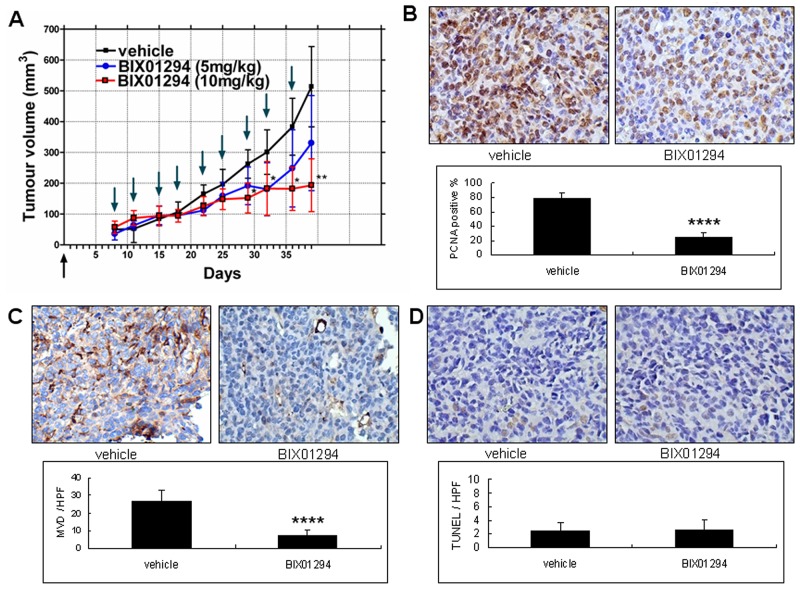
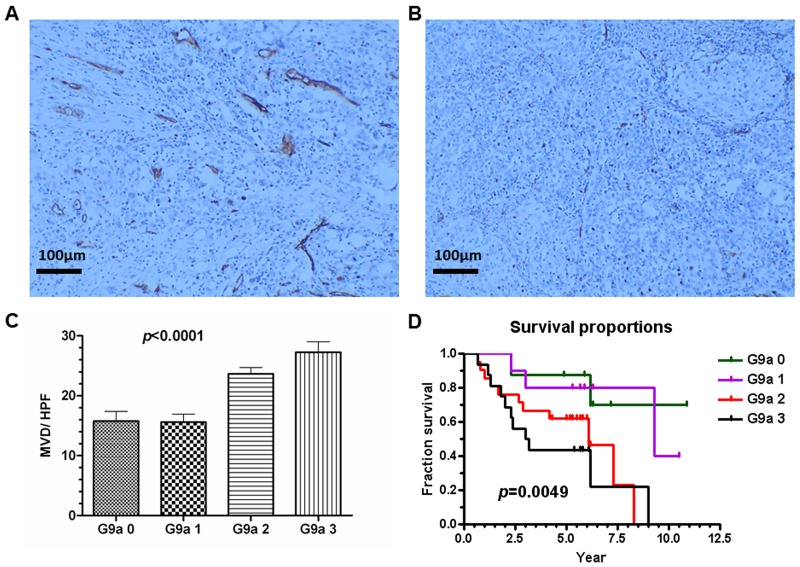
Research suggests that the epigenetic regulator G9a, a H3K9 histone methyltransferase, is involved in cancer invasion and metastasis. Here we show that G9a is linked to cancer angiogenesis and poor patient survival. Invasive cervical cancer has a higher G9a expression than cancer precursors or normal epithelium. Pharmacological inhibition and genetic silencing of G9a suppresses H3K9 methylation, cancer cell proliferation, angiogenesis, and cancer cell invasion/migration, but not apoptosis. Microarray and quantitative reverse transcription polymerase chain reaction analyses reveal that G9a induces a cohort of angiogenic factors that include angiogenin, interleukin-8, and C-X-C motif chemokine ligand 16. Depressing G9a by either pharmacological inhibitor or gene knock down significantly reduces angiogenic factor expression. Moreover, promoting G9a gene expression augments transcription and angiogenic function. A luciferase reporter assay suggests that knockdown of G9a inhibits transcriptional activation of interleukin-8. G9a depletion suppresses xenograft tumor growth in mouse model, which is linked to a decrease in microvessel density and proliferating cell nuclear antigen expression. Clinically, higher G9a expression correlates with poorer survival for cancer patients. For patients' primary tumors a positive correlation between G9a expression and microvessel density also exists. In addition to increasing tumor cell proliferation, G9a promotes tumor angiogenesis and reduces the patient survival rate. G9a may possess great value for targeted therapies.

Keywords: G9a; angiogenesis; cancer cell proliferation; patient survival; xenograft.


Conflict of interest statement

CONFLICTS OF INTEREST None declared.

Figures

Figure 1
Figure 1. G9a expression in cervical cancer tissue (400x)
(A) In normal squamous epithelium of the exocervix, G9a was not expressed. Strong immunostaining detected G9a in squamous cell carcinoma nuclei. (B) G9a positive grade 1. (C) G9a positive grade 2. (D) G9a positive grade 3. CA: carcinoma. NE: normal cervical epithelium.
Figure 2
Figure 2. G9a expression in cervical cancer cells and the anti-cell proliferation effect of G9a chemical inhibitor BIX01294
(A) Nuclear protein (10 μg) from the exponential phase of cervical cancer or normal human cervical epithelial cells (N1 and N2; 2 different lots) were used for G9a determination by western blot. Histone H3 was used as a loading control. L: long isoform. S: short isoform. (B) Effect of G9a chemical inhibitor BIX01294 on the methylation of histone 3 lysine 9. Histone H3 was used as a loading control. v: vehicle. The BIX01294 concentrations were 0 (vehicle), 1, 2.5, and 5 μM, respectively. (C) Effect of BIX01294 on the cell growth of cervical cancer cell lines. Cells were treated with 5 μM of BIX01294 at different times: viable cells were determined by MTT assay. Relative cell growth rates from day 0 were calculated. n = 5, *p < 0.05; **p < 0.01;****p < 0.0001. Data are presented as mean ± SD. (D) Effect of BIX01294 on the cell cycle of cervical cancer cell lines. Cells were treated with 5 μM of BIX01294: after 3 days, cell cycle was determined by propidium iodide staining. Different cell cycle phases are quantified. n = 5, ****p < 0.0001. Data are presented as mean ± SD.
Figure 3
Figure 3. Apoptotic effect of BIX01294 on cervical cancer cells
Cervical cancer cells (SiHa, HeLa and CaSki) were treated with BIX01294 for three days. Cervical cancer cells treated with 10 μg of staurosporine for 3 hrs were used as a positive control. (A) Active caspase-3 assay. Data presented are the level of active caspase-3. n = 3. ****p < 0.0001 (staurosporine vs. vehicle). ns: non-significant (BIX01294 vs. vehicle). (B) Flow cytometric assay by annexin-V/propidium iodide double staining for cancer cells after different treatment. (C) Quantitative data from Figure 3B. Apoptosis % were a sum of early apoptosis (lower right quadrant of cytogram, annexin-V positive and propidium iodide negative) and late apoptosis (upper right quadrant, annexin-V positive and propidium iodide positive). n = 3. ****p < 0.0001 (staurosporine vs. vehicle). ns: non-significant (BIX01294 vs. vehicle). AnV: annexin-V. PI: propidium iodide.
Figure 4
Figure 4. Quantitative results from effect of BIX01294 on apoptosis-related protein expression
SiHa cells were treated with BIX01294 (5 μM) for 4 hrs; after washing out the medium, cells were incubated in fresh culture medium for 24 hrs to collect conditioned medium. Total cell lysate was used for apoptosis-related protein expression pattern analysis. Quantitative results are of apoptosis-related protein expression in SiHa cells. No statistical difference was found between the apoptosis proteins and the reference spots. Data are presented as mean ± SD.
Figure 5
Figure 5. Quantitative results from effect of BIX01294 on angiogenesis-related protein expression
SiHa cells were treated with BIX01294 (5 μM) for 4 hrs; after washing out the medium, cells were incubated in fresh culture medium for 24 hrs to collect conditioned medium. Conditioned medium was used for angiogenic factor analysis. Quantitative results are of angiogenic factor expression in SiHa cells (**p < 0.01; ***p < 0.001; ****p < 0.0001). IL-8: interleukin-8. Data are presented as mean ± SD. (BIX01294, n = 3; control, n = 3). Three proteins shown in box had a BIX01294/vehicle ratio of less than 0.5. They were used for gene knockdown and overexpression studies.
Figure 6
Figure 6. Angiogenic factors’ gene expression as determined by G9a gene silencing, pharmacologic inhibition of G9a, and G9a overexpression
Cervical cancer cells (SiHa, HeLa and CaSki) were treated in one of the following ways: with control siRNA or G9a siRNA for 24 hrs; with BIX01294 (5 μM) or vehicle for 24 hrs; or with transient transfection with control plasmid (mock) or G9a over-expression plasmid (G9a-oe) for 48 hrs. The angiogenin, interleukin-8 (il-8) or cxcl16 mRNA expression was determined by real-time quantitative RT-PCR. Data presented here are the relative percentages of induction. Data are compared between the indicated groups. *p < 0.05, n = 3.
Figure 7
Figure 7. Angiogenic protein expression as determined by G9a gene silencing, pharmacologic inhibition of G9a, and G9a overexpression
Cervical cancer cells (SiHa, HeLa and CaSki) were treated in one of the following ways: with control siRNA or G9a siRNA for 24 hrs; with BIX01294 (5 μM) or vehicle for 24 hrs; or with transient transfection with control plasmid (mock) or G9a over-expression plasmid (G9a-oe) for 48 hrs. The expression of angiogenin, interleukin-8 (IL-8) or CXCL16 protein in a 24 hr-conditioned medium was determined by EIA. Data are compared between the indicated groups. *p < 0.05, n = 3.
Figure 8
Figure 8. Cervical cancer cells treated with conditioned medium from BIX01294 lose angiogenic capability
SiHa cells were treated with BIX01294 (5 μM) for 4 hrs; after washing out the medium, cells were incubated in fresh culture medium for 24 hrs to collect conditioned medium. Conditioned medium was used for the following in vitro angiogenesis assays: (A) Conditioned medium from vehicle or BIX01294 treated cells was used for an endothelial cell permeability assay. Data were the relative permeability, in which vehicle-treated conditioned medium is defined as 100%. n = 5. **p < 0.01. (B) Endothelial cell migration assay. Data were the number of migrated endothelial cells per HPF (100x) under different conditions. n = 5. **p < 0.01. (C) Conditioned medium from vehicle or BIX01294 treated cells was used for an endothelial cell proliferation assay. Data were the relative endothelial cell growth percentages under different conditions, in which vehicle-treated conditioned medium is defined as 100%. n = 5. **p < 0.01. (D) Endothelial cell tube formation assay. Data were the number of polygonal vascular tube formations per HPF (100x) under different conditions. n = 5. **p < 0.01. Data are presented as mean ± SD. CM: conditioned medium. EC: endothelial cell. HPF: high power field. veh: vehicle.
Figure 9
Figure 9. G9a inhibitor BIX01294 inhibits cervical cancer cell migration and invasion
(A) Confluent SiHa cells were pretreated with 5 μM of BIX01294 24 hrs prior to an in vitro wound healing migration assay. Migration distances were measured in HPF (100x). n = 5. **p < 0.01. Data are presented as mean ± SD. (B) SiHa cells were pretreated with BIX01294 (5 μM) 24 hrs prior to an in vitro transwell invasion assay. Invaded cells were calculated in HPF (100x). Data are presented as mean ± SD. n = 5. **p < 0.01. (C) SiHa cells which were pretreated with vehicle or 2 μM of BIX01294 for 24 hrs were used to analyze the intravasation phenotype in vivo by chick embryo chorioallantoic membrane (CAM) assay. SiHa cells (1 x 10⁶) were inoculated on the CAM of 9-day-old chick embryos; the membrane at the opposite side of the egg was recovered after a 48 hr incubation. Invasion cells were determined by detecting human DNA with Alu sequences in each CAM sample by PCR; chick (Ch) GAPDH was used as an internal control. (D) Ratio of Alu to chGAPDH in vehicle and BIX01294 treated groups. n = 5. **p < 0.01. Data are presented as mean ± SD. HPF: high power field.
Figure 10
Figure 10. Effect of BIX01294 on the tumor growth curve of SiHa cells
SiHa cell lines were seeded in the right hind limb of SCID mice. (A) The mice were divided randomly into three groups. In the first group, vehicle was injected intraperitoneally (normal saline, 100 μL, twice a week). For the second group, mice were injected intraperitoneally with BIX01294 at 5 mg/kg (mouse body weight; dissolved in normal saline, 100 μL, twice a week). Finally, in the third group mice were injected intraperitoneally with BIX01294 at 10 mg/kg (mouse body weight; dissolved in normal saline, 100 μL, twice a week). In the BIX01294 10mg/kg group, tumor growth was inhibited significantly 29 d after inoculation. In the BIX01294 5mg/kg group, tumor growth did not differ significantly from the control group (n = 10 in each group. *p < 0.05; **p < 0.01; ANOVA with post hoc Tukey’s test). Upward arrow (in black): cancer cell inoculation. Downward arrow (in green): vehicle or BIX01294 injection. (B) Tumors from vehicle and BIX01294 (10 mg/kg) treatment groups were harvested at the time of sacrifice (day 39 after inoculation) and fixed in 10% neutral buffered formalin and processed for proliferating cell nuclear antigen (PCNA). Representative images of PCNA staining are shown in the upper panel (400x). Quantification of the positive rate is shown in the lower panel. n = 20 in each group. ****p < 0.0001. (C) Representative images of CD31 staining in tumor xenografts are shown in the upper panel (400x). Microvessel density (MVD) counts are shown in the lower panel. n = 20 in each group. ****p < 0.0001. (D) Representative images of terminal deoxynucleotidyl transferase dUTP nick end labeling (TUNEL) are shown in the upper panel (400x). TUNEL counts are shown in the lower panel. n = 20 in each group. p > 0.05. Data are presented as mean ± SD. HPF: high power field.
Figure 11
Figure 11. G9a expression correlates with microvessel density (MVD) and with poor clinical survival rate
G9a expression in human cervical cancer tissue was scored on a scale ranging from negative (grade 0) to positive (grades 1 to 3). MVD was counted by CD31 staining under HPF (100x). (A) Example of high MVD (26/HPF). (B) Example of low MVD (6/HPF). (C) The correlation of MVD and G9a levels in human cancer tissue. Total n = 275, p < 0.0001 (one-way ANOVA). (D) Survival proportions and G9a expression patterns were calculated. Total n = 55, p = 0.0049 (Logrank test for trend). HPF: high power field.

Similar articles

Cited by

References

    1. Mathon NF, Lloyd AC. Milestones in cell division: cell senescence and cancer. Nat Rev Cancer. 2001;1:203–213. - PubMed
    1. Folkman J. Angiogenesis in cancer, vascular, rheumatoid and other disease. Nat Med. 1995;1:27–31. - PubMed
    1. Counter CM, Avilion AA, LeFeuvre CE, Stewart NG, Greider CW, Harley CB, Bacchetti S. Telomere shortening associated with chromosome instability is arrested in immortal cells which express telomerase activity. EMBO J. 1992;11:1921–1929. - PMC - PubMed
    1. Evan GI, Vousden KH. Proliferation, cell cycle and apoptosis in cancer. Nature. 2001;411:342–348. - PubMed
    1. Fidler IJ. The pathogenesis of cancer metastasis: the “seed and soil” hypothesis revisited. Nat Rev Cancer. 2003;3:453–458. - PubMed