. 2018 Feb;25(2):241-254.
doi: 10.1038/cdd.2017.150. Epub 2017 Sep 29.

Coordinated repression of BIM and PUMA by Epstein-Barr virus latent genes maintains the survival of Burkitt lymphoma cells

Affiliations

Coordinated repression of BIM and PUMA by Epstein-Barr virus latent genes maintains the survival of Burkitt lymphoma cells

Leah Fitzsimmons et al. Cell Death Differ. 2018 Feb.

Abstract

While the association of Epstein-Barr virus (EBV) with Burkitt lymphoma (BL) has long been recognised, the precise role of the virus in BL pathogenesis is not fully resolved. EBV can be lost spontaneously from some BL cell lines, and these EBV-loss lymphoma cells reportedly have a survival disadvantage. Here we have generated an extensive panel of EBV-loss clones from multiple BL backgrounds and examined their phenotype comparing them to their isogenic EBV-positive counterparts. We report that, while loss of EBV from BL cells is rare, it is consistently associated with an enhanced predisposition to undergo apoptosis and reduced tumorigenicity in vivo. Importantly, reinfection of EBV-loss clones with EBV, but surprisingly not transduction with individual BL-associated latent viral genes, restored protection from apoptosis. Expression profiling and functional analysis of apoptosis-related proteins and transcripts in BL cells revealed that EBV inhibits the upregulation of the proapoptotic BH3-only proteins, BIM and PUMA. We conclude that latent EBV genes cooperatively enhance the survival of BL cells by suppression of the intrinsic apoptosis pathway signalling via inhibition of the potent apoptosis initiators, BIM and PUMA.


Conflict of interest statement

The authors declare no conflict of interest.

Figures

Figure 1
Figure 1
Examples of patterns of EBV gene expression. Schematic showing the Latency III EBV gene expression programme (as found in B cells transformed in vitro into lymphoblastoid cell lines (LCLs)) and the Latency I EBV gene expression programme (as found in the majority of EBV-positive BL tumours and cell lines derived from these tumours). Latent proteins (EBNA1, EBNA2, EBNA3A, EBNA3B, EBNA3C, EBNA-LP, BHRF1, LMP1 and LMP2A/B) are shown in blue. Non-coding RNAs (EBERs, BHRF1 microRNAs and miR-BARTs) are shown in red, and latent promoters (Cp, Wp, Qp and LMP promoters) are shown in green
Figure 2
Figure 2
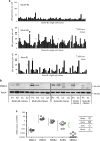
Genome loads and viral gene expression in BL single-cell clones. (a) Cells from each clonal cell line grown from a single cell by limiting dilution were harvested, lysed and analysed by q-PCR to enumerate the average EBV genome copy number per cell. Quantitation was calculated relative to Namalwa-BL cells, which contain two integrated copies of EBV per cell and these data were normalised to the housekeeping gene, β2M, of which diploid cells carry two copies. Clones of Dante-BL showed little variation in EBV copy number and yielded no EBV-loss clones, whereas Mutu-BL and Kem-BL cells had more variable genome loads and yielded EBV-loss clones (denoted by an asterisk). (b) Expression of EBV latent protein, EBNA1, in isogenic EBV-positive (P1-P2) and EBV-loss (n1-n2) BL clones. Probing for β-actin was used as a loading control. (c) Transcription of Latency I-associated genes in EBV-positive clones of Akata-BL (◯), Awia-BL (□), Kem-BL (formula image) and Mutu-BL (Δ) expressed relative to the endogenous control, GAPDH, and shown relative to the range seen in a panel of eight Latency I BL cell lines (grey bracket), including those from which the EBV-loss clones were isolated, as described elsewhere. EBNA2 expression is shown compared with the range seen in a panel of five LCLs (green bracket). EBNA1 refers to Q-U-K transcripts driven from the Qp promoter that are indicative of Latency I. BARTs refers to BamHI A transcripts that are spliced between exons 1 and 3 (the excised RNA gives rise to miR-BARTs)
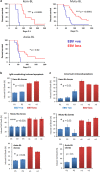
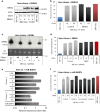
Figure 3
Figure 3
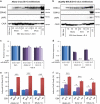
In vivo and in vitro phenotype of isogenic EBV-positive and EBV-loss BL clones. (a) Tumorigenicity of BL clones in NSG mice. Kaplan–Meier survival plots comparing survival in days post inoculation (P.I.) with isogenic EBV-positive (blue) or EBV-loss clones (red) derived from the parental EBV-positive BL cells lines as indicated. Kem-BL clones, EBV-positive n=12, EBV-loss n=24, median survival (MS) 54versus 102 days. Mutu-BL clones, EBV-positive n=19, EBV-loss n=29, MS 63versus 113 days. Awia-BL clones, EBV-positive n=12, EBV-loss n=12, MS 50versus 68 days. (b) Apoptotic cell death induced in response to BCR crosslinking with anti-IgM antibodies in isogenic EBV-positive (P1–P3) versus EBV-loss (n1–n3) clones of Kem-BL, Mutu-BL and Awia-BL, 72 h post-treatment compared with vehicle-only controls. (c) Ionomycin-induced cell death in isogenic EBV-positive (P1–P3) versus EBV-loss (n1–n3) clones of Kem-BL, Mutu-BL and Awia-BL (48 h), compared with vehicle-treated controls. Data are the mean and standard deviation (S.D.) of pooled data from three independent experiments, each carried out in triplicate. Unpaired, two-tailed Student’s T-tests were carried out to assess the significance of any difference in response between EBV-positive and EBV-loss clones from each background and P-values are indicated. Additionally, a two-way analysis of variance (ANOVA) to compare all clones from all BL tumours showed that overall EBV has a highly significant effect on cell survival (P<0.0001) in response to both ionomycin and IgM crosslinking
Figure 4
Figure 4
Apoptotic phenotype of EBV-loss Kem-BL clones re-expressing Latency I-associated genes. EBV-loss Kem-BL clones (n1–n3) re-expressing EBNA1 (a and b), EBERs (c and d), miR-BARTs (e and f) or empty vector (controls), marked (+) and (−), respectively, compared with isogenic EBV-loss (EBV −ve) and parental EBV-positive cells (EBV +ve). (a) EBNA1 protein expression, blotted with human AMo serum with probing for actin used as a loading control. (b) Survival of ionomycin-treated EBNA1-expressing EBV-loss BL cells compared with controls. (c) EBER expression was detected by Northern blotting using a probe to the EcoRI J fragment of the EBV genome, using 5 S as a loading control. (d) Survival of ionomycin-treated, EBER-expressing EBV-loss BL cells compared with controls. (e) Expression of mature BART miRs by q-PCR, expressed from the Cluster 1 (top), Cluster 2 (middle) or miR-BART-5 only (bottom) constructs, relative to levels in Kem-BL. (f) Survival of ionomycin-treated miR-BART-expressing EBV-loss BL cells compared with controls. All F-UTG-transduced cells in (a,b,e and f) induced with dox for 24 h before experiments were carried out. In apoptosis assays (b,d and f), cell death was induced by treatment with ionomycin for 48 h. Data are representative of assays that were carried out in triplicate on three independent occasions
Figure 5
Figure 5
EBV gene expression and apoptosis sensitivity in EBV-loss clones of BL reinfected with Akata virus or ΔCpWp-B95.8 rEBVs. (a and b) Western blot analysis of EBV latent protein expression in EBV-loss BL clones of Akata (An1-5), Kem (Kn1-3) and Mutu (Mn1-3) reinfected with Akata virus (Ak-V) (panel a, left) or ΔCpWp-B95.8 (B-V) virus (panel b, right). Latency III LCLs express EBNA1, EBNA2 and LMP1, but Latency I reinfectants express only EBNA1 protein. EBV-loss cells that had not been reinfected express only the cellular loading control, calregulin (CALR). (c and d) Expression of miR-BARTs in EBV-loss clones reinfected with Akata virus (Ak-V) (panel c, left) or ΔCpWp-B95.8 virus (B-V) (panel d, right) quantified using stem-loop real-time PCR. Representative data for three miRNAs from BART cluster 1 (miR-BARTs 3, 15 and 5) and two from BART cluster 2 (miR-BARTs 22 and 7) are shown relative to levels in the EBV-positive, Latency I cell line, Kem-BL. Note: the ΔCpWp-B95.8 virus genome harbours a deletion spanning miR-BARTs 22 and 7 (denoted as Δ) as well as the 3′ end of the miR-BART-5 pre-miRNA. (e) Survival of EBV-loss clones reinfected with Akata virus (Ak-V, purple) after challenge with ionomycin for 48 h relative to untreated controls and compared with EBV-positive parental BL cells (wt, blue) and EBV-loss BL cells from the same clonal background (−ve, red). (f) Survival of EBV-loss BL clones reinfected with ΔCpWp-B95.8 virus (B-V, purple) after challenge with ionomycin for 48 h relative to untreated controls and compared with EBV-positive parental BL cells (wt, blue) and EBV-loss BL cells from the same clonal background (−ve, red). Data are presented as the mean and S.D. of three independent experiments, each carried out in triplicate. Statistical significance was determined using an unpaired, two-tailed Student’s T-test, **P<0.01, *P<0.05
Figure 6
Figure 6
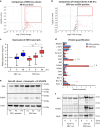
Apoptosis-related transcript and protein expression in ionomycin+Q-VD.OPh-treated Kem-BL clones. (a) Volcano plot of changes in apoptosis-related transcripts in EBV-loss BL clones treated with ionomycin and Q-VD.OPh for 48 h versus 0 h. The red box indicates significantly differentially regulated genes, as determined using cutoffs of FC >2 and P-value <0.05. (b) Volcano plot of transcriptional changes in apoptosis-related genes in EBV-loss clones compared with their EBV-positive counterparts, treated with ionomycin and Q-VD.OPh for 48 h. The red box indicates the significantly differentially regulated genes, as determined using cutoffs of FC >2 and P-value <0.05. (c) Box plot of expression data for the 13 genes that are differentially regulated between EBV-loss clones treated for 48 versus 0 h, but not between EBV-positive and EBV-loss BL clones at 48 h. This subset appears to be an EBV-loss-specific gene expression signature. However, this comparison illustrates that this subset of genes is also upregulated in EBV-positive BL clones, but to a lesser extent than in the clones that have lost EBV. (d) Summary of apoptosis-related protein expression in EBV-positive (blue) versus EBV-loss (red) clones of Kem-BL treated with ionomycin and Q-VD.OPh for 48 h. Quantitation is relative to untreated Jurkat cells. Three proteins, which we found to be undetectable in Kem-BL, are omitted (CFLAR, BAD and CASP8AP2). Data are presented as mean and S.D. of three separate experiments. Red circle in BCL-XL expression data represents one outlier result from a single EBV-loss clone. (e) BIM and PUMA protein expression in EBV-positive (P1–P3) versus EBV-loss (n1–n3) Kem-BL clones treated with ionomycin and Q-VD.OPh for 48 h. Calregulin (CALR) was included as a loading control. Images are representative from three independent experiments. (f) Western blots showing BIM and PUMA expression in EBV-positive Kem-P1 cells compared with EBV-loss Kem-n2 cells at 0, 3 or 6 h after treatment with ionomycin plus Q-VD.OPh, compared with the loading control, calregulin (CALR). Expression data for all samples at all time points post exposure to ionomycin in hours (h) are expressed relative to EBV-positive BL clones at time 0. Statistical significance was determined using a two-tailed Student’s T-test, **P<0.01, *P<0.05 and ns is not significant
Figure 7
Figure 7
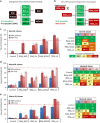
Apoptotic phenotype of EBV-positive and EBV-loss clones of BL clones expressing dox-inducible BIMS-BH3 variants. (a) Binding specificity of endogenous prosurvival BCL-2 family members (green) to proapoptotic BH3-only proteins (black). (b) Binding specificity of BIMS-BH3 variants (red) to the different prosurvival BCL-2 family members (green), dotted line indicates weak binding of BIMS-2a to A1/BFL1. (c–e) Apoptosis in EBV-positive (blue) versus EBV-loss clones (red) of Kem-BL (c), Akata-BL (d) and Mutu-BL (e) expressing BIMS variants; BIMS-4e (negative control), BIMS-BAD, BIMS-2a, BIMS-NOXA and BIMS-wt. The left panel shows representative data (mean and S.D.) for a single experiment and the right-hand panel shows mean values from three independent experiments. Induced cell death was calculated relative to cell death in untreated control cells. All samples were treated with doxycycline to activate BIMS variant expression and induce cell death. Viable cells were defined as Annexin-V/propidium iodide (PI) double negative. Statistical significance was determined using a two-tailed Student’s T-test to compare cell survival in each EBV-loss clone to the EBV-positive control in response to each BIMS-BH3 variant. Where a variant induced significantly more death in an EBV-loss clone compared with the EBV-positive control, this is noted in the right-hand panel, ***P<0.001, **P<0.01 and *P<0.05. The average amount of death induced by ionomycin treatment in EBV-loss clones from each tumour background is denoted by a dashed red line for comparison

Similar articles

Cited by

References

    1. Magrath I. Epidemiology: clues to the pathogenesis of Burkitt lymphoma. Br J Haematol 2012. - PubMed
    1. Pelengaris S, Khan M, Evan G. c-MYC: more than just a matter of life and death. Nat Rev Cancer 2002; 2: 764–776. - PubMed
    1. Strasser A, Cory S, Adams JM. Deciphering the rules of programmed cell death to improve therapy of cancer and other diseases. EMBO J 2011; 30: 3667–3683. - PMC - PubMed
    1. Egle A, Harris AW, Bouillet P, Cory S. Bim is a suppressor of Myc-induced mouse B cell leukemia. Proc Natl Acad Sci USA 2004; 101: 6164–6169. - PMC - PubMed
    1. Michalak EM, Jansen ES, Happo L, Cragg MS, Tai L, Smyth GK et al. Puma and to a lesser extent Noxa are suppressors of Myc-induced lymphomagenesis. Cell Death Differ 2009; 16: 684–696. - PMC - PubMed

Publication types

MeSH terms