. 2017 Oct 5;550(7674):128-132.
doi: 10.1038/nature24028. Epub 2017 Sep 27.

Discovery of a selective catalytic p300/CBP inhibitor that targets lineage-specific tumours

Affiliations

Discovery of a selective catalytic p300/CBP inhibitor that targets lineage-specific tumours

Loren M Lasko et al. Nature. .

Erratum in

  • Author Correction: Discovery of a selective catalytic p300/CBP inhibitor that targets lineage-specific tumours.
    Lasko LM, Jakob CG, Edalji RP, Qiu W, Montgomery D, Digiammarino EL, Hansen TM, Risi RM, Frey R, Manaves V, Shaw B, Algire M, Hessler P, Lam LT, Uziel T, Faivre E, Ferguson D, Buchanan FG, Martin RL, Torrent M, Chiang GG, Karukurichi K, Langston JW, Weinert BT, Choudhary C, de Vries P, Kluge AF, Patane MA, Van Drie JH, Wang C, McElligott D, Kesicki EA, Marmorstein R, Sun C, Cole PA, Rosenberg SH, Michaelides MR, Lai A, Bromberg KD. Lasko LM, et al. Nature. 2018 Jun;558(7710):E1. doi: 10.1038/s41586-018-0111-5. Nature. 2018. PMID: 29769713

Abstract

The dynamic and reversible acetylation of proteins, catalysed by histone acetyltransferases (HATs) and histone deacetylases (HDACs), is a major epigenetic regulatory mechanism of gene transcription and is associated with multiple diseases. Histone deacetylase inhibitors are currently approved to treat certain cancers, but progress on the development of drug-like histone actyltransferase inhibitors has lagged behind. The histone acetyltransferase paralogues p300 and CREB-binding protein (CBP) are key transcriptional co-activators that are essential for a multitude of cellular processes, and have also been implicated in human pathological conditions (including cancer). Current inhibitors of the p300 and CBP histone acetyltransferase domains, including natural products, bi-substrate analogues and the widely used small molecule C646, lack potency or selectivity. Here, we describe A-485, a potent, selective and drug-like catalytic inhibitor of p300 and CBP. We present a high resolution (1.95 Å) co-crystal structure of a small molecule bound to the catalytic active site of p300 and demonstrate that A-485 competes with acetyl coenzyme A (acetyl-CoA). A-485 selectively inhibited proliferation in lineage-specific tumour types, including several haematological malignancies and androgen receptor-positive prostate cancer. A-485 inhibited the androgen receptor transcriptional program in both androgen-sensitive and castration-resistant prostate cancer and inhibited tumour growth in a castration-resistant xenograft model. These results demonstrate the feasibility of using small molecule inhibitors to selectively target the catalytic activity of histone acetyltransferases, which may provide effective treatments for transcriptional activator-driven malignancies and diseases.


Figures

Extended Data Figure 1
Extended Data Figure 1. A-485 binds to p300-BHC
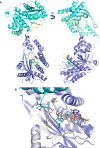
(a) A-485 inhibits the acetyltransferase activities of p300-BHC under EDTA-free conditions. The TR-FRET activity assay was performed using p300-BHC purified in the absence of EDTA and without EDTA in the assay buffer. The TR-FRET signal observed with DMSO control was normalized to 100. Error bars represent the S.D. of 3 independent biological replicates (A-485 no Zinc); n=2 for A-485+100 µM Zinc. Source data for (a) is provided. (b) A-485 binding to p300-BHC was assessed via a thermal shift assay (TSA) as described in the Online Methods. Lys-CoA was used a positive control. A-485 and both concentrations of Lys-CoA increased the stability of p300-BHC by 5.8 °C. A representative melting profile of four independent experiments is shown. (c) Superposition of the Δp300 HAT A-485 complex (green) with the inactive Δp300 HAT Y1467F mutant (white) complexed with acetyl-CoA (teal) (PDB ID: 4PZS) shows A-485 is competitive with acetyl-CoA. The L1 loop is shown in yellow.
Extended Data Figure 2
Extended Data Figure 2. Data collection and refinement statistics for Δp300 HAT Domain complexed with A-485
Extended Data Figure 3
Extended Data Figure 3. Δp300 HAT-A-485 complex crystal packing with lysine tunnel insertion
(a) The loop at the end of helix 6 inserts into the peptide binding site of a symmetry related molecule (teal). A-485 is shown in green sticks, and the L1 loop is yellow. (b) Lys-1558 of a symmetry related Δp300 HAT (teal) inserts into the lysine tunnel in a similar fashion as the lysine portion of Lys-CoA (PDB ID: 3BIY) (gray) bound in the inactive Δp300 HAT Y1467F mutant (PDB ID: 3BIY).
Extended Data Figure 4
Extended Data Figure 4. Structural model of specificity of A-485 for p300/CBP over other HATs
(a) Superposition of human PCAF (PDB ID: 1CM0) in white showing motifs A-D colored magenta, yellow, purple, and blue respectively with human TIP60 (PDB ID: 2OU2) in cyan, and A-485 in orange spheres. These two HATs serve as representatives of the two primary structural classes observed upon superposition of the HAT domains of hMYST3 (PDB ID: 2OZU), hPCAF (PDB ID: 1CM0), hHAT1 (PDB ID: 2P0W), hTIP60 (PDB ID: 2OU2), and hGCN5 (PDB ID: 1Z4R). (b) Zoomed in view of superposition of human PCAF as above and of p300 in pale blue complexed with A-485 with the L1 loop shown in green. Note that both the L1 loop and A-485 clash with the Helix in motif A. (c) A-485 does not compete with peptide substrate binding to p300-BHC protein. Peptide binding was assessed via an AlphaLISA-based peptide substrate binding assay as described in the Online Methods. All data were normalized to the p300-BHC/biotin peptide complex signal set at 100%. All measurements are the result of 29 technical replicates over two independent experiments. Error bars represent S.D. of the technical replicates.
Extended Data Figure 5
Extended Data Figure 5. A-485 is more potent than C646 and decreases p300/CBP auto-acetylation in cells
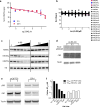
(a) PC-3 cells were treated with C646 for the indicated times and then processed for H3K27Ac via high content microscopy as described in the Online Methods. The fluorescent intensity observed with the DMSO control for H3K27Ac was normalized to 100. Error bars represent the S.D. of 4 independent biological replicates. (b) PC-3 cells were treated with A-486 for 3 h and then processed for high content microscopy as described in the Online Methods (n=2). Source data for (a,b) are provided. (c) A-485 but not enzalutamide (Enz) inhibits H3K27Ac and H3K18Ac in DHT-stimulated LnCaP-FGC cells after 24 h. Cells were treated with 5-fold dilutions of A-485 or enzalutamide (Enz) starting at 10 µM or DMSO as a control (C). A representative western blot of 2 independent biological replicates is shown. (d) 22Rv1 cells were treated with 0.3 µM or 3 µM A-485 or DMSO as a control (C) for 1 h and processed for western blotting as described in the Online Methods. (e) Cells were treated with 3 µM A-485 (A) or DMSO as a control (C) for 24 h and processed for western blotting as described in the Online Methods. (f) A-485 exhibits similar inhibition of H3K27Ac in AR+ and AR prostate cancer cells (experiment performed as per Fig. 3a) but is selectively anti-proliferative in AR+ cells (data from Fig. 3c is shown). For (c-e) gel source data, see Supplementary Figure 1
Extended Data Figure 6
Extended Data Figure 6. p300/CBP siRNAs inhibit cell proliferation and p300/CBP activity in LnCaP-FGC cells
LnCaP-FGC cells were starved of androgens for 72 h and then the indicated siRNAs were delivered via nucleofection. After 24 h, cells were then treated with 30 pM Mibolerone and either (a) measured at indicated times for 3H-Thymidine incorporation or (b) processed at 2 days for western blotting for the indicated proteins as described in the Online Methods. Error bars represent the S.D. of 8 technical replicates. Source data for (a) is provided. For gel source data, see Supplementary Figure 1
Extended Data Figure 7
Extended Data Figure 7. A-485 inhibits AR activity in LnCaP-FGC and VCaP cells
DHT-stimulated (a) or androgen depleted (b) LnCaP-FGC cells were treated with the indicated compounds at the indicated concentrations (in µM) for 24 h and processed for qRT-PCR for the indicated genes as described in the Online Methods. (c,d) VCaP cells were starved of androgens for 24 h and then treated as per (a,b). The mean of n=2 independent experiments is shown for (a-d). The expression (Exp) observed for the DMSO control of in the indicated genes was normalized to 1 using the Bio-Rad CFX 3.1 Manager software. Source data for (a-d) are provided. (e) LnCaP-FGC cells were treated with compounds as per Extended Data Fig. 5c and processed for western blotting as described in the Online Methods. For gel source data, see Supplementary Figure 1.
Extended Data Figure 8
Extended Data Figure 8. A-485 inhibits AR activity in a manner distinct from AR antagonism and inhibits proliferation and PSA expression in 22Rv1 cells
(a) DHT-stimulated LnCaP-FGC cells were treated with A-485 (left panel) or Enz (right panel) for 24 h and processed for qRT-PCR analysis as described in the Online Methods. Enz is shown as an AR antagonist control. (b) Androgen depleted 22Rv1 cells were treated with the indicated compounds for 5 days and processed for analysis of cell proliferation as described in the Online Methods. Error bars represent the S.D. of 6 independent experiments for A-485 and 3 independent experiments for A-486 and Enz. (c) 22Rv1 cells were starved of androgens for 72 h and then treated with the indicated compounds for 24 h and processed for qRT-PCR as described in the Online Methods. The mean of n=2 independent experiments is shown for (a,c). The PSA expression (Exp) observed for the DMSO control was normalized to 1 using the Bio-Rad CFX 3.1 Manager software. Source data for (a-c) are provided.
Extended Data Figure 9
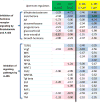
Extended Data Figure 9. Ingenuity upstream regulator analysis indicates that A-485 but not Enz inhibits additional pathways beyond hormone receptor at 6 h
Z-scores of >2 and <-2 are significant.
Extended Data Figure 10
Extended Data Figure 10. A-485 inhibits c-Myc in 22Rv1 cells and A-485 dosing of LuCaP-77 CR tumor bearing mice tumor induces a decrease in tumor c-Myc protein levels and moderate body weight loss
(a) Androgen-depleted 22Rv1 cells were treated with A-485 or Enz for 24 h and processed for western blot analysis as described in the Online Methods. A representative western blot of 2 independent biological replicates is shown. (b) A-485 dosing of LuCaP-77 CR tumor bearing mice induces a decrease in tumor SLC45A3 and c-Myc mRNA levels. Animals were dosed for 7 days per the BID dosing schedule shown in Fig. 4f and tumors were excised 3 h and 16 h post final dose. Expression (Exp) in (b) was normalized as per Fig. 4a. Error bars represent the S.D. of n=4 animals per indicated group. (c) LuCap-77 CR tumor-bearing mice were dosed with the A-485 or vehicle control as per (b) and tumors were processed for western blot analysis as described in the Online Methods. For (a,c) gel source data, see Supplementary Figure 1. (d) Exposure of A-485 in plasma and tumors after 7 d dosing of A-485. Error bars represent the S.D. of 4 animals. (e) Average body weight for same animals bearing LuCaP-77 CR tumors dosed with A-485 in Fig. 4f. The mean body weights of the animals (n=8) in each group were measured. Source data for (b,d, and e) are provided.
Figure 1
Figure 1. A-485 potently inhibits p300/CBP in vitro
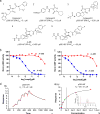
(a) Chemical structures of screening hits (1,2), Compound R (3), A-485 (4) and the inactive control compound A-486 (5). (b,c) A-485 but not A-486 inhibits the acetyltransferase activities of p300-BHC (b) and CBP-BHC (c). The TR-FRET signal observed with DMSO control was normalized to 100. Error bars for A-485 represent the S.D. of 3 independent biological replicates; n=1 for A-486. (d,e) Representative p300 binding curves and fits of four independent biological replicates for p300-HAT binding in single-cycle mode with injection spikes removed (d) and steady-state evaluation for A-486 (e) via surface plasmon resonance. The inset in (e) shows the corresponding binding curves from which the steady-state data was derived. Source data for (b-e) are provided.
Figure 2
Figure 2. Crystal structure of A-485 bound to Δp300 HAT
(a) Superposition of the Δp300 HAT-A-485 complex (green) with the inactive Δp300 HAT Y1467F mutant complexed with the bi-substrate inhibitor Lys-CoA (PDB ID: 3BIY,gray). (b) Zoomed view of the A-485 binding site. Key interacting residues are shown with hydrogen bonds indicated by red dashes (some residues are omitted for viewing clarity). The 2Fo-Fc electron density map calculated at 1.95Å for A-485 is contoured at 1σ. (c) Comparison of the Δp300 HAT-A-485 complex (green) with the Acetyl-CoA bound structure (PDB ID: 4PZS) (gray) illustrates how a subtle shift in helix 3 accommodates the fluorophenyl ring in a hydrophobic pocket. (d) A-485 is a competitive acetyl-CoA-site p300 inhibitor. The IC50 for A-485 were calculated as per Fig. 1b. Error bars represent S.D. of 3 independent technical replicates (source data are provided).
Figure 3
Figure 3. A-485 potently inhibits p300/CBP in cells
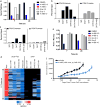
(a) Analysis of high content microscopy shows that A-485, but not the inactive control compound A-486 decreases H3K27Ac (open squares) but not H3K9Ac (closed squares) after 3 h treatment in PC-3 cells. Error bars represent the S.D. of 3 independent biological replicates. (b) A-485 is selective for the p300 substrates H3K27Ac and H3K18Ac over other epigenetic marks after 3 h treatment in PC-3 cells (n=2). The fluorescent intensity observed with DMSO control for the indicated histone epigenetic mark was normalized to 100 for (a,b). Source data for (a,b) are provided. (c) A-485 is selectively anti-proliferative in 10 different solid and hematological tumor types. Cell proliferation assays were performed as described in the online methods.
Figure 4
Figure 4. A-485 inhibits AR activity in prostate cancer
(a) qRT-PCR analysis shows that A-485 and enzalutamide (Enz) inhibit DHT-stimulated PSA mRNA expression in LnCaP-FGC cells (n=2 independent biological replicates; two technical replicates per experiment). The PSA expression (Exp) observed for the DMSO control was normalized to 1 using the Bio-Rad CFX 3.1 Manager software. (b,c) A-485 and Enz inhibit H3K27Ac occupancy at the PSA enhancer (b), but only Enz inhibits AR occupancy (c); n=2 independent biological replicates. (d) Comparison of A-485 and Enz on 217 genes modulated by DHT in the indicated cell line after 6 h treatment. (e) A-485 inhibits c-Myc expression in androgen depleted 22Rv1 cells (n=2 independent biological replicates). c-Myc expression (Exp) in (e) was normalized as per (a). (f) A-485 is efficacious in the LuCaP-77 CR xenograft model. A-485 was dosed as indicated. Error bars represent the S.E.M. of n=8 animals per group. The black arrow denotes initiation of dosing and the black bar denotes the range of days animals were dosed. Source data for (a-c, e, f) are provided.

Similar articles

Cited by

References

    1. Tessarz P, Kouzarides T. Histone core modifications regulating nucleosome structure and dynamics. Nat. Rev. Mol. Cell. Biol. 2014;15:703–708. - PubMed
    1. Simon RP, Robaa D, Alhalabi Z, Sippl W, Jung M. KATching-Up on Small Molecule Modulators of Lysine Acetyltransferases. J. Med. Chem. 2016;59:1249–1270. - PubMed
    1. Iyer NG, Ozdag H, Caldas C. p300/CBP and cancer. Oncogene. 2004;23:4225–4231. - PubMed
    1. Balasubramanyam K, et al. Polyisoprenylated benzophenone, garcinol, a natural histone acetyltransferase inhibitor, represses chromatin transcription and alters global gene expression. J. Biol. Chem. 2004;279:33716–33726. - PubMed
    1. Lau OD, et al. HATs off: selective synthetic inhibitors of the histone acetyltransferases p300 and PCAF. Mol. Cell. 2000;5:589–595. - PubMed

Publication types

MeSH terms