. 2017 Sep 25;42(6):600-615.e4.
doi: 10.1016/j.devcel.2017.08.024.

Tension Creates an Endoreplication Wavefront that Leads Regeneration of Epicardial Tissue

Affiliations

Tension Creates an Endoreplication Wavefront that Leads Regeneration of Epicardial Tissue

Jingli Cao et al. Dev Cell. .

Abstract

Mechanisms that control cell-cycle dynamics during tissue regeneration require elucidation. Here we find in zebrafish that regeneration of the epicardium, the mesothelial covering of the heart, is mediated by two phenotypically distinct epicardial cell subpopulations. These include a front of large, multinucleate leader cells, trailed by follower cells that divide to produce small, mononucleate daughters. By using live imaging of cell-cycle dynamics, we show that leader cells form by spatiotemporally regulated endoreplication, caused primarily by cytokinesis failure. Leader cells display greater velocities and mechanical tension within the epicardial tissue sheet, and experimentally induced tension anisotropy stimulates ectopic endoreplication. Unbalancing epicardial cell-cycle dynamics with chemical modulators indicated autonomous regenerative capacity in both leader and follower cells, with leaders displaying an enhanced capacity for surface coverage. Our findings provide evidence that mechanical tension can regulate cell-cycle dynamics in regenerating tissue, stratifying the source cell features to improve repair.

Keywords: endoreplication; epicardium; heart; mechanical tension; polyploidy; regeneration; zebrafish.


Figures

Figure 1
Figure 1. Transient Hypertrophy and Polyploidy in Regenerating Epicardial Cells
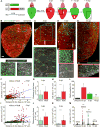
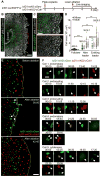
(A) Schematic for epicardial ablation and regeneration in vivo. White arrows indicate the direction of regeneration. OFT, outflow tract; V, ventricle. The frames with letters indicate regions shown in (C–E). (B) Flattened images of a whole-mounted uninjured heart stained with an anti-ZO1 antibody (red). Framed regions are enlarged below in the same scale as the enlarged panels of (C–E). ZO1 staining is outlined by dashed lines. Scale bar, 100 µm. (C–E) Flattened images of whole-mounted adult hearts at 3 (C), 5 (D) and 14 dpi (E) stained with an anti-ZO1 antibody (red). Framed regions are enlarged below in the same scale, with epicardial ZO1 staining outlined by dashed lines. White arrows indicate the direction of regeneration. Scale bars, 50 µm. (F–H) Quantifications of epicardial cell area and distance from the ventricular base at 3 dpi. Mononucleate cells (Mono) are represented by cyan dots (F) or bars (G, H), and multinucleate cells (Multi) by red dots (F) or bars (G, H). n = 94 for Mono and 161 for Multi. The blue lines in (F) show regression results for Mono and Multi, respectively. (F) P < 0.001, ANCOVA. *** P < 0.001, Mann-Whitney Rank Sum Test. Bars indicate mean ± S.D. (I–K) Similar quantifications as (F–H), using samples at 5 dpi. n = 401 for Mono and 198 for Multi. (I) P < 0.001, ANCOVA. *** P < 0.001, Mann-Whitney Rank Sum Test. Bars indicate mean ± S.D. (L) Quantification of multinucleation for uninjured, 3, 5 and 14 dpi hearts. n = 4 (uninjured), 5 (3 dpi), 4 (5 dpi) and 3 (14 dpi) hearts, respectively. * P < 0.05; ns, not significant; Mann-Whitney Rank Sum Test. Bars indicate mean ± S.D. (M) Quantification of cell area distribution for uninjured, 3, 5 and 14 dpi hearts. n = 449 (uninjured), 255 (3 dpi), 599 (5 dpi) and 1,678 (14 dpi), respectively. Numbers on the plot indicate mean values. *** P < 0.001, Mann-Whitney Rank Sum Test. Bars indicate S.D. See also Figures S1 and S2, Movie S1.
Figure 2
Figure 2. Emergence of Leader and Follower Cells ex vivo
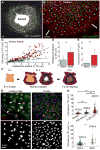
(A) tcf21:nucEGFP epicardial cells migrating from an explant after 5 d culture in a coated dish. The front of the leading edge is outlined with a magenta dashed line, and the mononucleate cell domain is outlined with a yellow dashed line. Scale bar, 100 µm. (B) tcf21:nucEGFP explant culture stained for ZO1. White arrows indicate direction of migration. Scale bar, 100 µm. (C) Quantification of cell area and distance to the explant for samples in (B). Mononucleate cells are represented by cyan dots and multinucleate cells by red dots. n = 224 (Mono) and 166 (Multi) respectively. The blue lines show regression results for Mono and Multi, respectively. P < 0.001, ANCOVA. (D, E) Distribution of cell distances to explant (D) and cell areas (E) for mononucleate (Mono) and multinucleate cells (Multi). n = 224 (Mono) and 166 (Multi) respectively. *** P < 0.001, Mann-Whitney Rank Sum Test. Bars indicate mean ± S.D. (F–I) Polyploidy and hypertrophy of murine fetal epicardial cells. (F) Schematic of murine epicardial explant culture. The colors indicate location of regions quantified in (H). (G) A 72-h culture stained for WT1 (red) and ZO1 (green) indicating epicardial cells at the leading edge (left) or the center (right). Nuclear staining is blue in merged images and white in bottom panels. Yellow arrows denote binucleate cells. (H) Quantification of cell areas at three different regions. n = 352 (center), 299 (200–400 µm from the front of leading edge) and 451 (0–200 µm) respectively. Numbers on the plot indicate mean values. (I) Quantification of cell areas at the leading edge (0–200 µm from the front) for mononucleate (Mono, n = 329) and multinucleate (Multi, n = 122) cells. Numbers on the plot indicate mean values. *** P < 0.001, Mann-Whitney Rank Sum Test. Bars indicate mean ± S.D. Scale bar, 50 µm. See also Figure S3.
Figure 3
Figure 3. Endomitosis and Endocycling Events Underlie Epicardial Cell Polyploidy
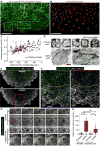
(A) (Top) Schematic of experimental design to detect epicardial cell fusion. (Middle) Image of the framed region represented in the cartoon acquired after 5 d culture. (Bottom) The region framed in yellow, enlarged to show detail. Asterisk indicates actin meshwork (green) covering a red nucleus, not a fused cell. Scale bar, 100 µm. (B) Video frames of FUCCI cell cycle analysis of explanted epicardial cells. A 3-d culture of an explant carrying FUCCI reporters was subjected to live imaging for 13 h. White dashed lines outline the explant, and yellow dashed lines outline the leading edge. Arrows and lowercase letters denote nuclei shown in (C). Scale bar, 100 µm. (C) Video frames of the nuclei highlighted in (B) showing cytokinesis (cell a), endomitosis (cell b) and endocycling (cell c). Scale bar, 20 µm. Timing, hh:mm. (D) Spatial distribution of cell cycle behaviors. Cell positions were calculated at the point of nuclear membrane breakdown (for cytokinesis and endomitosis) or fluorescent change from green to red (for endocycling). n = 56 (cytokinesis), 59 (endomitosis) and 35 (endocycling), respectively. Numbers on the plot indicate mean values. Blue dashed line marks 200 µm position. *** P < 0.001, Mann-Whitney Rank Sum Test (compared with cytokinesis). Bars indicate mean ± S.D. (E) Video frames of explanted epicardial cells from a tcf21:LifeAct-EGFP; tcf21:H2A-mCherry line showing normal cytokinesis (top) and cytokinesis failure in an endomitotic cell (bottom). White arrows indicate start of cleavage furrow ingression, yellow arrows indicate formation of midbodies and cyan arrows indicate furrow abscission or regression. Scale bar, 20 µm. Timing, hh:mm. (F) Spatial distribution of successful and failed cytokinesis. Cell positions were calculated at the point of nuclear membrane breakdown. n = 48 (Success) and 35 (Failure), respectively. Numbers on the plot indicate mean values. *** P < 0.001, Mann-Whitney Rank Sum Test. Bars indicate mean ± S.D. (G–I) Quantifications of the durations for cleavage furrow ingression (G), midbody formation (H), and the total time of both (I), for successful and failed cytokinesis, respectively. Ingression time is defined as the time from the dense LifeAct-EGFP signal emergence between two daughter nuclei (white arrows in (E)) to the formation of the narrowest furrow (yellow arrows in (E)). Midbody time was defined as the time from the narrowest furrow formation to furrow abscission or furrow regression (cyan arrows in (E)). n = 48 (Success) and 35 (Failure), respectively. Numbers on the plot indicate mean values. *** P < 0.001; ns, not significant; Mann-Whitney Rank Sum Test. Bars indicate mean ± S.D. See also Figure S4, Movies S2–S5.
Figure 4
Figure 4. Leader Cells Display Higher Migration Velocity and Mechanical Tension than Followers
(A) Epicardial explant culture showing F-actin and nuclei by tcf21:LifeAct-EGFP;tcf21:H2A-mCherry reporters. The framed regions were enlarged for display in (D). LifeActEGFP shown in green and H2A-mCherry shown in red. Scale bars, 100 µm. (B) Same experiment in (A) showing velocity vectors (white arrows) for each nucleus (H2A-mCherry, red) in a 5-h window. Scale bars, 100 µm. (C) Dot plot for each individual nucleus indicating the average speed in 15.5 h over the average distance from the leading edge. The blue line indicates the regression result. n = 224. (D) Magnified view of the framed regions in (A). LifeActEGFP shown in inverted grayscale. Scale bars, 20 µm. (E, F) A 5-day tcf21:H2A-EGFP (green) epicardial explant culture was stained with pMLC (Ser19, grayscale). The framed regions in (E) are enlarged to show details in (F). The yellow dashed lines approximately separate follower (top) and leader cell regions (below). Scale bars, 100 µm. (G) Video frames of explanted epicardial cells from a tcf21:LifeAct-EGFP line showing laser incisions and recoil of the cells. LifeAct-EGFP is shown in grayscale. Red double arrows indicate position and length of incisions. F, follower cells; L, leader cells. Scale bars, 20 µm. (H) Quantification of the initial recoil velocity of leader and follower cells after cutting in a direction parallel or perpendicular to the migration direction. n = 12 (parallel-follower), 16 (parallel-leader), 14 (perpendicular-follower) and 15 (perpendicular-leader) respectively. *** P < 0.001; ns, not significant; Mann-Whitney Rank Sum Test. Bars indicate S.D. See also Movies S4 and S6.
Figure 5
Figure 5. Mechanical Tissue Stretching Promotes Epicardial Endoreplication
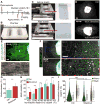
(A) Schematic of experimental design in (C–F). (B) An elastic chamber with culture surface areas of 7 × 23 mm2 (right) and 7 × 26 mm2 (left). (C) Culture chambers before (top) and after stretch (bottom). Enlarged views of a chamber with heart explants and PBS are shown on the right. (D) Explant culture from tcf21:nucEGFP animals with (bottom) or without (top) 100% stretch. The double arrow indicates stretch direction. nucEGFP is shown in white. Scale bars, 100 µm. (E) Explant culture from tcf21:LifeAct-EGFP;tcf21:H2A-mCherry animals after 100% stretch. (Top) LifeActEGFP is shown in green and H2A-mCherry is shown in red. The framed region is enlarged to show LifeAct-EGFP (grayscale) below. The double arrow indicates stretch direction. Scale bars, 100 µm. (F) Experiment as in (D) is shown, visualizing tcf21:nucEGFP tissue with cell shapes outlined using a WGA stain (grayscale). Top, unstretched control; bottom, 100% stretch. The double arrow indicates stretch direction. White arrows denote multinucleate cells close to the explant. Scale bars, 100 µm. (G) Quantification of epicardial cell multinucleation in a quadrant of the cell sheet shown in (F). n = 28 (Ctrl) and 26 (Stretched) explants, respectively. *** P < 0.001, Mann-Whitney Rank Sum Test. Bars indicate mean ± S.D. (H) Distribution plot showing the percentages of multinucleate cells at different regions of the epicardial cell sheet for both unstretched (Ctrl) and stretched cultures. Distances of cells to explant were normalized to the migration distances of the cell sheets and expressed as a percentage. n = 27 (Ctrl) and 31 (Stretched) explants respectively. *** P < 0.001; ** P < 0.01; ns, not significant; Mann-Whitney Rank Sum Test. Bars indicate mean ± S.D. (I) Frequency plot showing the distances of cells to explants for mononucleate (Mono, green) and multinucleate (Multi, yellow) cells, respectively, for both unstretched (Ctrl) and stretched cultures. Distances of cells to explant were normalized to the migration distances of the cell sheets and expressed as a percentage. n = 7,183 (Ctrl, Mono), 3,390 (Ctrl, Multi), 3,959 (Stretched, Mono) and 3,994 (Stretched, Multi) cells, respectively. *** P < 0.001, Mann-Whitney Rank Sum Test. Bars indicate S.D. See also Figure S5.
Figure 6
Figure 6. Follower Cells Undergo Endoreplication after Leader Cell Ablation
(A) Schematic for experiments in (B–F). (B, C) Ablation experiment using tcf21:nucEGFP explants (green). Twenty-four h post laser ablation, the explant culture was stained to detect pMLC (Ser19, grayscale). The framed regions in (B) are enlarged to show details in (C). The yellow dashed lines approximately mark the region that was ablated. Scale bars, 200 µm (B) or 100 µm (C). (D) Quantification of nucleation and cell area of de novo leader cells and pre-existing leader and follower cells in (B). Leader cell region is defined by the strong staining of pMLC. Mono, mononucleate; Multi, multinucleate. n = 111 (follower), 39 (new leader, Mono), 49 (new leader, Multi), 10 (existing leader, Mono), and 89 (existing leader, Multi), respectively. *** P < 0.001; ** P < 0.01; Mann-Whitney Rank Sum Test. Bars indicate S.D. (E) Video frames of a tcf21:FUCCI epicardial explant culture subjected to live imaging and laser ablation. The top panel is an image before ablation; the middle panel, immediately after ablation; the lower panel, a reconstructed leader cell region at 42 h, 45 min after ablation. The white, cyan and yellow arrows indicate nuclei that underwent endomitosis, endocycling and cytokinesis, respectively. Timing, hh:mm. Scale bar, 100 µm. (F) Cropped video frames of the numbered cells indicated in the middle panel of (E). Timing, hh:mm. Scale bar, 20 µm. See also Movie S7.
Figure 7
Figure 7. High Regenerative Capacity in Endoreplicated Cells
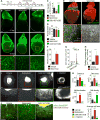
(A) Schematic for experiments in (B–H). tcf21:NTR; tcf21:nucEGFP animals were used. (B) Epicardial regeneration ex vivo in the presence of DMSO (Vehicle), 10 µm SB431542, or 0.5 µm GSK1007102B. White dashed lines outline the explants. Framed regions are enlarged to show details below. Scale bar, 100 µm. (C) Quantification of GFP fluorescence density from images captured at 12 dpi. n = 18 (Vehicle), 18 (SB431542), and 13 (GSK1007102B), respectively. *** P < 0.001, Student’s t-test (compared with Vehicle). Bars indicate mean ± S.D. (D) Quantification of timing to repopulate the ablated ventricular surface. n = 36 (Vehicle), 26 (SB431542), and 21 (GSK1007102B), respectively. ** P < 0.01; ns, not significant; Mann-Whitney Rank Sum Test (compared with Vehicle). Bars indicate mean ± S.D. (E) Flattened images of whole-mounted hearts with ZO1 staining (red). Hearts were treated with DMSO (Vehicle) or SB431542 for 12 d (14 dpi). Framed regions are enlarged below, with nucEGFP shown in green, ZO1 in grayscale and outlined in yellow. Scale bar, 100 µm. (F) Quantification of epicardial cell multinucleation in hearts treated with DMSO (Vehicle) or SB431542 for 12 d (14 dpi). n = 4 hearts for each. * P < 0.05, Mann-Whitney Rank Sum Test. Bars indicate mean ± S.D. (G) Quantification of epicardial cell area in hearts treated with DMSO (Vehicle) or SB431542 for 12 d (14 dpi). n = 822 (Vehicle) and 477 (SB431542) respectively. Numbers on the plot indicate mean values. *** P < 0.001, Mann-Whitney Rank Sum Test. Bars indicate S.D. (H) Regenerative capacity on a per cell basis, with or without SB431542 treatment, measured by area covered per day by a digitalized nucleus. Area was measure at day 0 (2 dpi) and day 10 (12 dpi) of treatment, and cell density was measured at day 10 (12 dpi). One digitalized nucleus is defined as 30 GFP pixels. n = 18 explants for each group. *** P < 0.001, Mann-Whitney Rank Sum Test. Bars indicate mean ± S.D. (I) Epicardial explant culture assays with Vehicle, Blebbistatin (10 µM), GSK1007102B (0.5 µM) or LY294002 (50 µM) treatment. tcf21:nucEGFP explants (shown in white) were plated for 5 d. Blebbistatin was added from day 3 to day 5, and GSK1007102B and LY294002 were added from day 0 to day 5. Framed regions are enlarged below to show details. Scale bar, 200 µm. (J) Experiment as in (H) using tcf21:LifeAct-EGFP; tcf21:H2A-mCherry tissue. Scale bar, 200 µm. (K) Quantification of epicardial growth. Skirt area is defined as the area covered by epicardial tissue growth from the explant. For migration distance and skirt area, n = 40 (Vehicle), 30 (Blebbistatin), 27 (GSK1007102B), and 19 (LY294002) explants, respectively. For nucleation, cell density, and average cell area, n = 10 explants for each treatment. *** P < 0.001; ** P < 0.01; Student’s t-test for migration distance and skirt area, Mann-Whitney Rank Sum Test for cell density, nucleation, and average cell area. All comparisons were versus Vehicle-treated group. Bars indicate mean ± S.D. See also Figures S6 and S7, Movie S8.

Comment in

Similar articles

Cited by

References

    1. Abmayr SM, Balagopalan L, Galletta BJ, Hong SJ. Cell and molecular biology of myoblast fusion. Int. Rev. Cytol. 2003;225:33–89. - PubMed
    1. Abmayr SM, Pavlath GK. Myoblast fusion: lessons from flies and mice. Development. 2012;139:641–56. - PMC - PubMed
    1. Akimoto S, Mitsumata M, Sasaguri T, Yoshida Y. Laminar shear stress inhibits vascular endothelial cell proliferation by inducing cyclin-dependent kinase inhibitor p21(Sdi1/Cip1/Waf1) Circ. Res. 2000;86:185–90. - PubMed
    1. Benham-Pyle BW, Pruitt BL, Nelson WJ. Cell adhesion. Mechanical strain induces E-cadherin-dependent Yap1 and beta-catenin activation to drive cell cycle entry. Science. 2015;348:1024–7. - PMC - PubMed
    1. Cao J, Navis A, Cox BD, Dickson AL, Gemberling M, Karra R, Bagnat M, Poss KD. Single epicardial cell transcriptome sequencing identifies Caveolin 1 as an essential factor in zebrafish heart regeneration. Development. 2016;143:232–43. - PMC - PubMed

Publication types

LinkOut - more resources