. 2017 Nov;49(11):1602-1612.
doi: 10.1038/ng.3963. Epub 2017 Sep 25.

Enhancer connectome in primary human cells identifies target genes of disease-associated DNA elements

Affiliations

Enhancer connectome in primary human cells identifies target genes of disease-associated DNA elements

Maxwell R Mumbach et al. Nat Genet. 2017 Nov.

Abstract

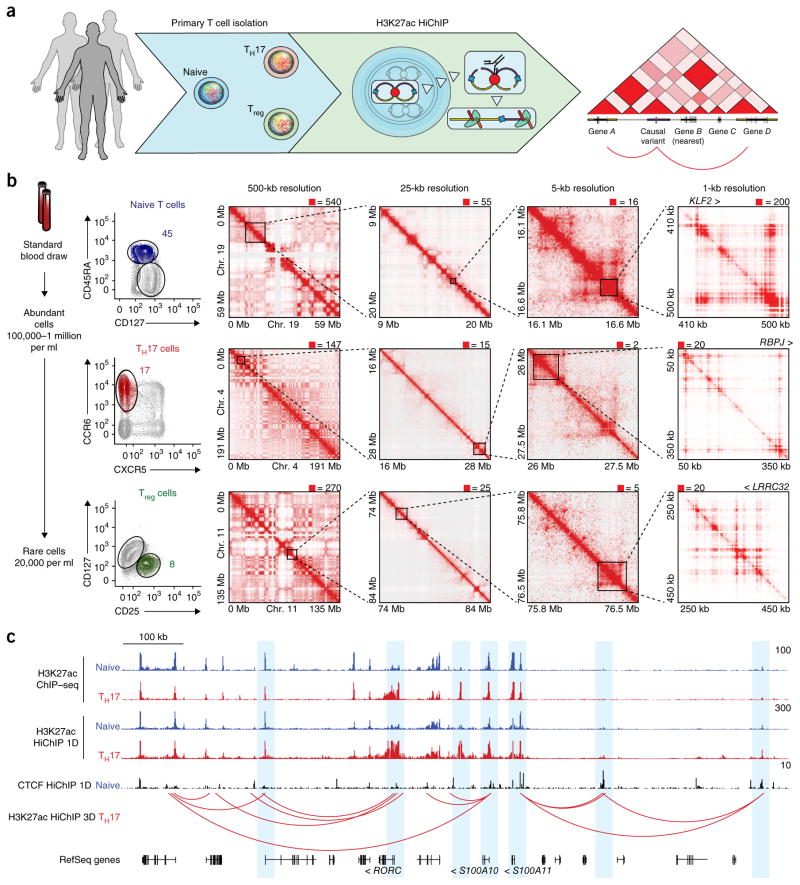
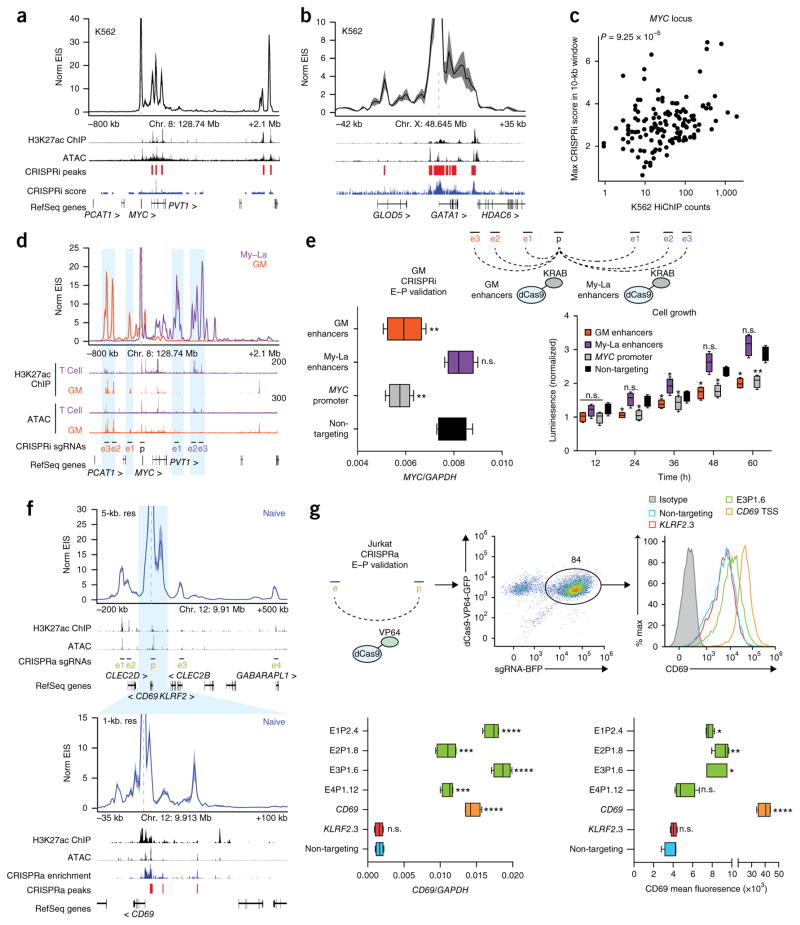
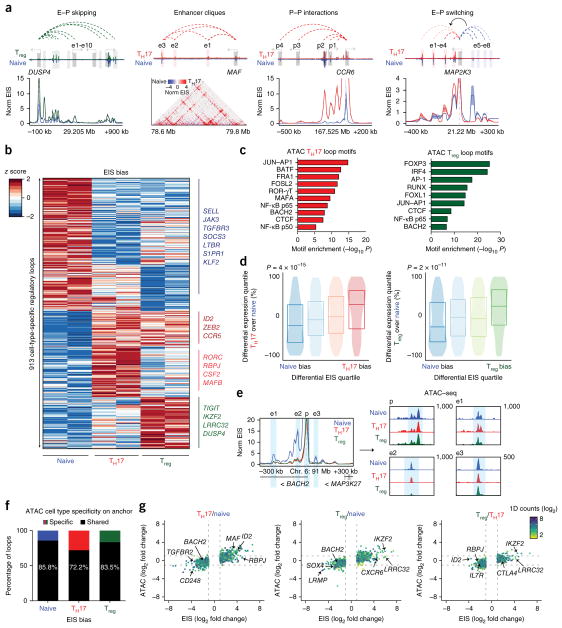
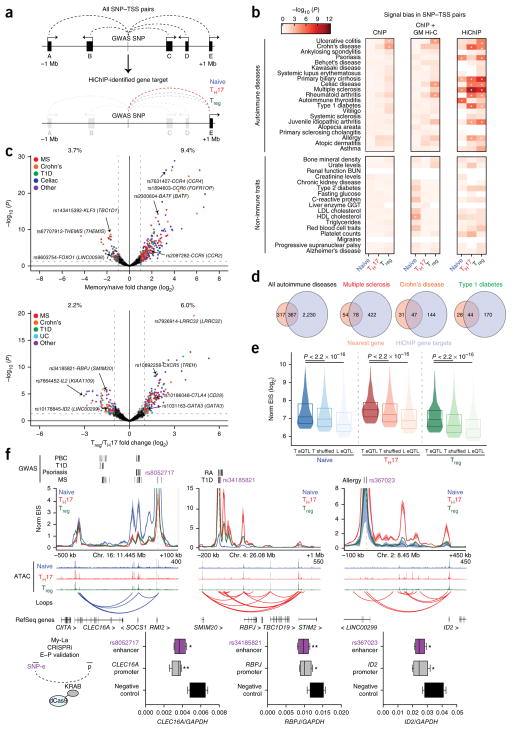
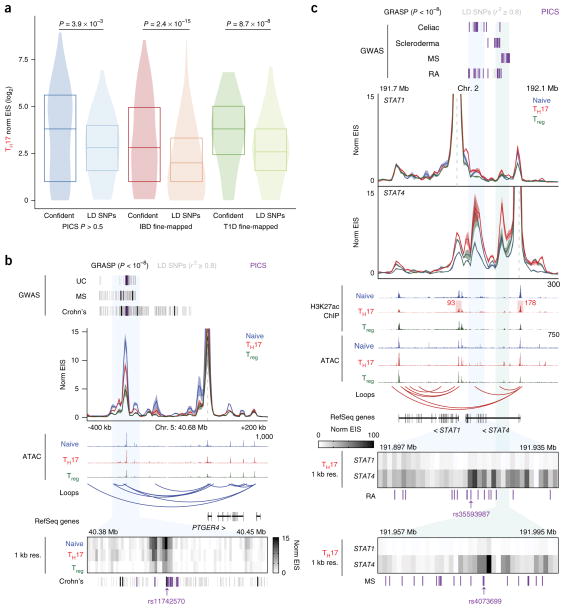
The challenge of linking intergenic mutations to target genes has limited molecular understanding of human diseases. Here we show that H3K27ac HiChIP generates high-resolution contact maps of active enhancers and target genes in rare primary human T cell subtypes and coronary artery smooth muscle cells. Differentiation of naive T cells into T helper 17 cells or regulatory T cells creates subtype-specific enhancer-promoter interactions, specifically at regions of shared DNA accessibility. These data provide a principled means of assigning molecular functions to autoimmune and cardiovascular disease risk variants, linking hundreds of noncoding variants to putative gene targets. Target genes identified with HiChIP are further supported by CRISPR interference and activation at linked enhancers, by the presence of expression quantitative trait loci, and by allele-specific enhancer loops in patient-derived primary cells. The majority of disease-associated enhancers contact genes beyond the nearest gene in the linear genome, leading to a fourfold increase in the number of potential target genes for autoimmune and cardiovascular diseases.


Conflict of interest statement

COMPETING FINANCIAL INTERESTS

The authors declare competing financial interests: details are available in the online version of the paper.

Figures

Figure 1
Figure 1
HiChIP identifies high-resolution chromosome conformation in primary human T cells. (a) Primary T cell H3K27ac HiChIP experimental outline. (b) Left, FACS strategy for naive, TH17, and Treg cells from total peripheral blood CD4+ T cells. Number represents the percentage of total CD4+ T cells within that gate. Right, Knight–Ruiz (KR) matrix–balanced interaction maps for naive, TH17, and Treg cells at 500-kb, 25-kb, and 5-kb resolution, and raw interaction maps at 1-kb resolution, centered on the KLF2, RBPJ, and LRRC32 loci. (c) HiChIP 1D and 3D signal enrichment at the RORC locus in TH17 over naive T cells.
Figure 2
Figure 2
Validation of regulatory elements identified by H3K27ac HiChIP with CRISPR interference and activation. (a) Interaction profile of the MYC promoter in K562 H3K27ac HiChIP at 10-kb resolution. K562 H3K27ac ChIP–seq data are from the Encyclopedia of DNA Elements (ENCODE). CRISPRi-validated regulatory regions in K562 cells are indicated. (b) Interaction profile of the GATA1 promoter in K562 H3K27ac HiChIP at 1-kb resolution. CRISPRi-validated regulatory regions in K562 cells are indicated. (c) Correlation of MYC K562 H3K27ac HiChIP signal with maximum CRISPRi score within the HiChIP 10-kb window. (d) Interaction profiles of the MYC promoter in GM and My-La H3K27ac HiChIP at 10-kb resolution. T cell H3K27ac ChIP–seq and ATAC–seq data are from naive T cells. (e) Top, CRISPRi validation in GM cells of GM- and My-La-biased MYC enhancers. E–P, enhancer–promoter. Bottom, MYC RNA levels by qRT–PCR and cell growth rates in CRISPRi GM cells with targeting of cell-type-biased enhancers, the MYC promoter, and a non-targeting negative control (n = 3 biological replicates, each with 2 technical replicates). (f) Interaction profile of the CD69 promoter in Jurkat H3K27ac HiChIP at 5-kb and 1-kb resolution. The 1-kb profile is focused on the window of the CRISPRa tiling screen. CRISPRa-validated regulatory regions in Jurkat cells are indicated. (g) Top, CRISPRa validation in Jurkat cells of CD69 distal enhancers. Bottom, CD69 RNA and protein levels in CRISPRa Jurkat cells with targeting of distal enhancers, the CD69 promoter, the KLRF2 promoter as a locus negative control, and a non-targeting negative control (n = 2 biological replicates, each with 2 technical replicates). In the box plots, each box extends from the 25th to the 75th percentile with a line representing the median, and whiskers extend to the minimum and maximum values. *P < 0.05; **P < 0.01; ***P < 0.001, ****P < 0.0001 one-way ANOVA followed by Dunnett’s multiple-comparisons test against the non-targeting control; n.s., not significant.
Figure 3
Figure 3
Dynamic 3D enhancer landscapes in T cell differentiation. (a) Conformational features observed by H3K27ac HiChIP. (b) HiChIP EIS in 913 differential interactions identified in T cell subtypes. Interactions are clustered by cell type specificity. (c) Cell-type-specific motif identification from ATAC–seq peaks in biased EIS anchors. (d) EIS bias quartiles for naive to TH17 and naive to Treg differentiation, with corresponding differential RNA gene expression rankings. (e) Interaction profile of the BACH2 promoter at 5-kb resolution, demonstrating shared accessibility signal at naive-biased EIS. (f) Proportion of ATAC–seq peaks within HiChIP differential interaction anchors that are cell type specific (log2 (fold change) > 1) or shared across all three subtypes. (g) Global correlation of EIS and ATAC–seq fold change in different pairwise comparisons of T cell subsets.
Figure 4
Figure 4
HiChIP identifies cell type specificity and target genes of autoimmune disease–associated variants. (a) Generation of a loop set between all autoimmune disease SNPs and gene promoters within a 2-Mb region. (b) H3K27ac ChIP and HiChIP signal bias in T cell subtypes for SNP–TSS pairs. For each bin, PICS SNPs are tagged by H3K27ac only in the concordant cell type for the bias tested. SNPs are grossly divided into associations with autoimmune diseases or control, non-immune traits. Asterisks indicate FDR < 5%. (c) EIS bias of SNP–TSS loops (with nearest gene annotated) in TH17 and Treg subsets (memory T cells) versus naive T cells and TH17 versus Treg cells. Percentages represent the percentage of SNP–TSS interactions that demonstrate biased HiChIP signal in the indicated cell type (log2 (fold change) > 1). MS, multiple sclerosis. (d) Number of HiChIP gene targets versus nearest-gene predictions for all looping non-genic autoimmune disease SNPs as well as SNPs for specific diseases. (e) Global validation of HiChIP SNP gene targets. Synthetic SNP–TSS pairs were generated from each CD4+ eQTL SNP to its associated gene and compared to both a distance-matched shuffled SNP–TSS pair and a liver (L) eQTL SNP–TSS pair. P values were calculated by Kolmogorov–Smirnov test. (f) HiChIP target gene RNA levels by qRT–PCR in CRISPRi My-La cells with targeting of SNP-containing enhancers of interest, as well as positive-control sgRNAs to the HiChIP target promoters and a non-targeting negative control (n = 3 biological replicates, each with 2 technical replicates). RA, rheumatoid arthritis; PBC, primary biliary cirrhosis. *P < 0.05; **P < 0.01, two-tailed Student’s t test. In box plots, each box extends from the 25th to the 75th percentile with a line representing the median, and whiskers extend to the minimum and maximum values.
Figure 5
Figure 5
Fine-mapping of GWAS-identified variants using H3K27ac HiChIP. (a) Global validation of HiChIP signal at putatively causal SNPs (confident) versus corresponding SNPs in LD (LD SNPs; r2 ≥ 0.8) for TH17 cells. SNP–TSS pairs were generated from published fine-mapping data sets, in comparison to a distance-matched SNP–TSS pair set in the same LD block. P values were calculated by Kolmogorov–Smirnov test. (b) Interaction profile of the PTGER4 promoter and a 1-kb-resolution visualization of the SNP-containing enhancer of interest. SNPs in LD (r2 ≥ 0.8) correspond to GRASP SNPs (genome-wide significance P < 1 × 10⁻⁸). The highlighted SNP was identified in both the high-confidence PICS and GRASP data sets. UC, ulcerative colitis. (c) Interaction profiles of the STAT1 and STAT4 promoters, with 1-kb-resolution visualizations of the SNP-containing enhancers of interest. 1D signal contributions at the STAT1 and STAT4 promoters are highlighted. Highlighted SNPs are PICS SNPs closest to focal EIS for STAT4.
Figure 6
Figure 6
HiChIP identifies allelic bias to target genes for cardiovascular disease risk variants. (a) Interaction profile of the TCF21 gene promoter for H3K27ac HiChIP of HCASMCs and naive T cells. (b) EIS bias between HCASMCs and naive T cells in a union set of CARDIoGRAMplusC4D CAD and PICS autoimmune disease SNP–TSS loops. Percentages represent the percent of SNP–TSS interactions that demonstrate biased HiChIP signal in the indicated cell type (log2 (fold change) > 1). (c) Quantile–quantile plot of allelic EIS imbalance in high-confidence loops. Allelic mapping biased loops were identified through simulation and removed before EIS analysis. (d) EIS bias between CAD risk variants and their alternative alleles to eQTL-associated target genes. (e) Allele-specific HiChIP interaction profiles at the 9p21.3 and SMAD3 loci at 10-kb resolution to examine the functional consequence of a risk variant as compared to its alternative allele. ATAC–seq and ChIP–seq data sets shown are from ref. .

Similar articles

Cited by

References

    1. Dixon JR, et al. Topological domains in mammalian genomes identified by analysis of chromatin interactions. Nature. 2012;485:376–380. - PMC - PubMed
    1. van Arensbergen J, van Steensel B, Bussemaker HJ. In search of the determinants of enhancer–promoter interaction specificity. Trends Cell Biol. 2014;24:695–702. - PMC - PubMed
    1. Lieberman-Aiden E, et al. Comprehensive mapping of long-range interactions reveals folding principles of the human genome. Science. 2009;326:289–293. - PMC - PubMed
    1. Rao SSP, et al. A 3D map of the human genome at kilobase resolution reveals principles of chromatin looping. Cell. 2014;159:1665–1680. - PMC - PubMed
    1. Fulco CP, et al. Systematic mapping of functional enhancer–promoter connections with CRISPR interference. Science. 2016;354:769–773. - PMC - PubMed

MeSH terms