. 2017 Nov 1;127(11):3970-3986.
doi: 10.1172/JCI95376. Epub 2017 Sep 25.

Commensal Propionibacterium strain UF1 mitigates intestinal inflammation via Th17 cell regulation

Affiliations

Commensal Propionibacterium strain UF1 mitigates intestinal inflammation via Th17 cell regulation

Natacha Colliou et al. J Clin Invest. .

Abstract

Consumption of human breast milk (HBM) attenuates the incidence of necrotizing enterocolitis (NEC), which remains a leading and intractable cause of mortality in preterm infants. Here, we report that this diminution correlates with alterations in the gut microbiota, particularly enrichment of Propionibacterium species. Transfaunation of microbiota from HBM-fed preterm infants or a newly identified and cultured Propionibacterium strain, P. UF1, to germfree mice conferred protection against pathogen infection and correlated with profound increases in intestinal Th17 cells. The induction of Th17 cells was dependent on bacterial dihydrolipoamide acetyltransferase (DlaT), a major protein expressed on the P. UF1 surface layer (S-layer). Binding of P. UF1 to its cognate receptor, SIGNR1, on dendritic cells resulted in the regulation of intestinal phagocytes. Importantly, transfer of P. UF1 profoundly mitigated induced NEC-like injury in neonatal mice. Together, these results mechanistically elucidate the protective effects of HBM and P. UF1-induced immunoregulation, which safeguard against proinflammatory diseases, including NEC.


Conflict of interest statement

Conflict of interest: M. Mohamadzadeh and B. Sahay are the inventors of P. UF1 (US provisional application no. US2016/032096).

Figures

Figure 1
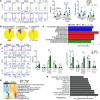
Figure 1. Abundance of Propionibacterium in the fecal samples of HBMF preterm infants.
Fecal samples were collected from HBMF (n = 20) and FF preterm infants (n = 20), and microbiota composition was analyzed by 16S rDNA sequencing. (A) Summary box plots of Chao richness, Shannon diversity, and Pielou’s evenness indices derived from analyses of fecal samples of HBMF (blue) and FF (red) preterm infants on day 13 ± 2 to 3. (B) Linear discriminant analysis (LDA) of taxons between HBMF and FF preterm infants’ microbiota on day 13 ± 2 to 3. Taxa enriched in HBMF preterm infants’ microbiota have a negative score (blue), and taxa enriched in FF preterm infants’ microbiota have a positive score (red). Only taxa with an absolute value of LDA score of more than 2 are shown. (C) Phylum structure of the abundant bacteria in fecal samples of HBMF and FF preterm infants on days 21 ± 3. (D) Taxonomic cladogram of HBMF versus FF preterm infants’ bacterial fecal samples on day 21 ± 3 (blue, HBMF-enriched taxa; red, FF-enriched taxa). (E) Percentage of operational taxonomic units (OTUs) of Propionibacteria in the fecal samples of HBMF and FF preterm infants by day 13 ± 2 to 3 and day 21 ± 3. (F) Relative abundance of different Propionibacteria (e.g., P. freudenreichii) in fecal samples of HBMF and FF preterm infants. Error bars indicate mean ± SEM. *P < 0.05; **P < 0.01, 2-tailed unpaired t test (A, E, and F). Kruskal-Wallis test (B and D).
Figure 2
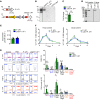
Figure 2. Characterization of P. UF1 bacterium.
(A) Genome sequence comparison of isolated P. UF1 with known P. freudenreichii spp. Shermanii CIRM-BIA1 (red) and P. freudenreichii spp. freudenreichii DSM20271T (blue). Prophage was identified by PHAST (green). Sequence identity between P. freudenreichii strains and P. UF1 is shown. (B) Correlation of the annotated genome sequence on the RAST platform with different metabolic pathways of P. UF1. Numbers in parentheses indicate numbers of annotated genes belonging to subcategories of pathways. (C and D) C57BL/6 mice (n = 3) were gavaged with P. UF1 (109 CFU/mouse) 1 time, and mice were sacrificed every day to detect P. UF1 in the fecal (C) and cecal (D) contents. (E) GF mice (n = 5) were gavaged with P. UF1 (109 CFU/mouse) 1 time, and fecal samples were collected every day to detect P. UF1. DL indicates the qPCR detection limit. Asterisks indicate statistical significance compared with day 0. Data are representative of 1 (E) or 3 (C and D) independent experiments. Error bars indicate mean ± SEM. *P < 0.05; **P < 0.01; ***P < 0.001; ****P < 0.0001, 2-tailed unpaired t test (CE).
Figure 3
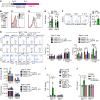
Figure 3. Modulation of colonic immune responses by HBMF preterm infants’ microbiota.
(AC) GF mice were transfaunated with HBMF preterm infants’ microbiota (blue), FF preterm infants’ microbiota (red), or FF preterm infants’ microbiota plus 4 treatments with P. UF1 (green) or were left untransfaunated (black). Colonic immune responses and microbiota were analyzed 2 weeks later. Representative data of flow plots, percentages, and total cell counts of Th17 cells and IL-10+TGF-β+ Tregs (A). Microbial phyla structure (B) and LDA analysis (C) of fecal samples from indicated group. (D) GF mice were monoassociated with P. UF1 (green) or gavaged with PBS (white), and induced colonic immune responses were analyzed. Representative data of flow plots, percentages, and total cell counts of Th17 cells, IL-10+TGF-β+ Tregs, and IFN-γ+CD4+ cells (Th1 cells). (E and F) Heatmap of selected metabolites differentiating fecal samples from PBS- and P. UF1–gavaged GF mice (E), and significant metabolic pathways of fecal samples from PBS- versus P. UF1–gavaged GF mice (F). Red dashed line shows permutation of P = 0.05. Data are pooled from 2 independent experiments (n = 3–7 mice/group, AC) or representative of 3 (n = 4–5 mice/group, E and F) or 6 (n = 4 mice/group, D) independent experiments. Error bars indicate mean ± SEM. *P < 0.05; **P < 0.01; ***P < 0.001; ****P < 0.0001, ANOVA plus Tukey’s post test (A) or 2-tailed unpaired t test (D).
Figure 4
Figure 4. Induction of Th17 cell differentiation by P. UF1.
(A) CD4+ splenic cells derived from C57BL/6 mice gavaged with P. UF1 were transferred into H2-Ab1–/– recipient mice. H2-Ab1–/– mice were gavaged 4 times (4×) with P. UF1 (109 CFU/mouse) or with PBS (n = 4–5 mice/group). Representative data of flow plots, percentages, and total cell counts of colonic Th17 cells. (B) Splenic CD4+ T cells were sorted and labeled with CFSE. T cells were cocultured with pulsed BMDCs with S-layer (10 μg/ml) or DlaT peptides (20 μg/mg) for 5 days. Cells were stained and analyzed by flow cytometry. Representative histogram plots of CFSE-labeled IL-17A+ CD4+ T cells. (C) C57BL/6 mice were gavaged 4 times with P. UF1. Splenic and MLN tetramer DlaT245+ cells were enriched with phycoerythrin (PE) beads and analyzed. Representative plots depicting the percentage of DlaT245+ tetramer CD4+ T cells with a majority of IL-17A+IL-10+ T cells, but negative for FoxP3+ T cells. (D) Th17 cell differentiation from naive splenic Thy1.1+CD4+CD45RBhi cells in Thy1.2+ Rag1–/– mice gavaged with P. UF1 or PBS. Th17 cell differentiation was analyzed in the colon (CL), small intestine (SI), MLN, and spleen (SP) (n = 5 mice/group). Data are representative of 2 (D) or 3 (AC) independent experiments. Error bars indicate mean ± SEM. *P < 0.05; **P < 0.01, ANOVA plus Tukey’s post test (A) or Mann-Whitney U test (D).
Figure 5
Figure 5. Differentiation of DlaT-specific Th17 cells.
(A) Genetic organization of the dlaT locus from P. UF1 and ΔdlaT P. UF1. P1, P2, P3, and P4 primers was used for identifying ΔdlaT P. UF1. cmR, chloramphenicol resistance gene (P. UF1); bla, ampicillin resistance gene (E. coli); ori, replication origin of pUC19 plasmid. (B) PCR amplification of dlaT with primers P1/P2. (C) Quantitative reverse-transcriptase PCR (qRT-PCR) analyses of dlaT mRNA expression using primers P3/P4 (n = 3 samples/group). (D) Western blot analysis of DlaT expression in the cell lysates and S-layer using polyclonal anti-DlaT antibodies. (E) Exponential growth rate of P. UF1 and ΔdlaT P. UF1 in MRS-lactate medium (n = 3 samples/group). (F) Colonization of P. UF1 and ΔdlaT P. UF1 in C57BL/6 mice (n = 2 mice/group). (G) GF mice were gavaged with P. UF1 (green), ΔdlaT P. UF1 (blue), or PBS (white). Colonic cell immune responses were analyzed 2 weeks later (n = 4 mice/group). Representative data of flow plots, percentages, and total cell counts of Th17 cells, CD4+FoxP3+ Tregs, IL-10+TGF-β+ Tregs, and IL-22+CD4+ T cells. Data are representative of 1 (F) or 3 (BE and G) independent experiments. Error bars indicate mean ± SEM. *P < 0.05; **P < 0.01; ***P < 0.001, 2-tailed unpaired t test (C and E) or ANOVA plus Tukey’s post test (G).
Figure 6
Figure 6. Restoring Th17 cell differentiation by complementation of ΔdlaT P. UF1 with dlaT.
(A) Complementation of ΔdlaT P. UF1 with the dlaT gene (P. UF1–1, orange), the 3 dlaT peptides (P. UF1–2, purple), and the dlaT gene minus the 3 peptides (P. UF1–3, gray). (B) Western blot analysis of DlaT expression and the 3 peptides in cell lysates of the complemented strains using polyclonal anti-DlaT antibodies. (C) Exponential growth rate of the complemented strains in MRS-lactate medium (n = 3 samples/group). (D) GF mice were gavaged with P. UF1–1, P. UF1–2, P. UF1–3 (109 CFU/mouse), or PBS on days 0, 3, 6, and 9. Two weeks later, induced colonic immune responses were analyzed. Representative data of flow plots, percentages, and total cell counts of Th17 cells, CD4+FoxP3+ Tregs, and IL-10+TGF-β+ Tregs. (E and F) Fecal sample metabolomic analyses of GF mice gavaged with aforementioned complemented strains or PBS. PCA of fecal sample metabolites (E) and comparison of significant pathways between P. UF1: P. UF1–1 and ΔdlaT P. UF1: P. UF1–2 (F). Red dashed line shows permutation P value of 0.05. Data are pooled from 2 independent experiments (n = 3–7 mice/group, D) or are representative of 1 (n = 3 mice/group, E and F) or 3 (B and C) independent experiments. Error bars indicate mean ± SEM. *P < 0.05; **P < 0.01, ANOVA plus Tukey’s post test (C) or Kruskal-Wallis plus Dunn’s post test (D).
Figure 7
Figure 7. Regulation of colonic immunity by P. UF1 during ΔactA L. m infection.
(A) B6.129(Cg)-Foxp3tm3(DTR/GFP)Ayr/J (Foxp3DTR) mice with no DT injection were gavaged with PBS (red), P. UF1 (green), or ΔdlaT P. UF1 (blue) and orally infected with ΔactA L. m. One group of mice was orally infected with ΔactA L. m3pep (gray). Representative data of flow plots, percentages, and total counts of colonic Th17 cells, Th1 cells, and FoxP3+IL-10+TGF-β+ Tregs. (B) Taxonomic cladogram of fecal microbiota from experimental groups (P < 0.05, Kruskal-Wallis test) from groups of C57BL/6 mice gavaged with P. UF1 or dlaT P. UF1 and orally infected with ΔactA L. m as described in A. (C) Heatmap of selected fecal metabolites (P < 0.05, 1-way ANOVA) from mouse groups as described in A. Data are pooled from 2 independent experiments (n = 4–7 mice/group, A) or representative of 2 independent experiments (n = 3 mice/group, B and C). Error bars indicate mean ± SEM. P < 0.05; *P < 0.05; **P < 0.01; ***P < 0.001, ANOVA plus Tukey’s post test (A).
Figure 8
Figure 8. Regulation of intestinal immunity requires SIGNR1.
(A) Depiction of SIGNR1-hFc expression. The cDNA encoding SIGNR1-extracellular domain (exons 4–10) was fused to the Fc of human IgG1. (B) Western blot analysis of SIGNR1-hFc using anti-SIGNR1 antibody. (C) Binding of P. UF1 to SIGNR1 (blue), SIGNR3 (red), control fusion (yellow), or secondary (2nd) antibody (green). (D) Blocking SIGNR1-hFc binding to P. UF1 by zymozan. (E) Relative expression of Signr1 and Signr3 genes in colonic tissue from mice gavaged with P. UF1 or PBS (n = 5 tissues/group). (F) Representative data analyses of SIGNR1+ DCs derived from mice gavaged with P. UF1 or PBS (n = 4 mice/group). (G) Signr1+/+ and Signr1–/– mice were gavaged 4 times with PBS (red), P. UF1 (green), or ΔdlaT P. UF1 (blue) and orally infected with ΔactA L. m. One group of mice was infected with actA L. m3pep (gray), and colonic responses were analyzed 7 days later. Representative data of flow plots, percentages, and total cell counts of Th17 cells, Th1 cells, and IL-10+TGF-β+ Tregs (n = 4–5 mice/group). (H) Determination of ΔactA L. m burden in fecal samples of indicated groups (n = 4–5 fecal samples/group) in Signr1+/+ and Signr1–/– mice. (I) Socs1 expression by qRT-PCR in colonic tissue of ΔactA L. m–infected Signr1+/+ and Signr1–/– mice gavaged with P. UF1 or ΔdlaT P. UF1 (n = 5–7 samples/group). (J) Socs1 expression in BMDCs isolated from Signr1+/+ and Signr1–/– mice (n = 3 samples/group). BMDCs were treated with MEK inhibitor PD0325901 (PD) or PBS. Cells were incubated with P. UF1 (1:2 CFU) or PBS for 3 hours. Data are representative of 2 (D, E and G-J) or 3 independent experiments (B, C and F). Error bars indicate mean ± SEM. *P < 0.05; **P < 0.01; ***P < 0.001, 2-tailed unpaired t test (E and F) or ANOVA plus Tukey post test (GJ).
Figure 9
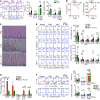
Figure 9. Mitigation of NEC-like injury by P. UF1 in newborn mice.
(A) C57BL/6 pregnant dams were gavaged with P. UF1 or PBS twice/week during gestation. Five days after birth, newborn mice were sacrificed. Representative data of flow plots, percentages, and total cell counts of Th17 cells and IL-10+TGF-β+ Tregs in newborn mice. Each dot represents 3 pooled small intestinal tissues from each group of newborn mice. (B and C) Five days after birth, newborn mice of dams gavaged with P. UF1 or PBS were separated and subjected to NEC-like injury. Newborn mice gavaged with PBS or P. UF1 (107 CFU/mouse) on days 1, 3, and 5. Newborn mice were sacrificed 6 days later. Survival curve and weight incidence of the newborn mice subjected to NEC-like injury (B), and representative H&E sections of the small intestine of control newborn mice (PBS) or mice subjected to NEC-like injury with or without P. UF1. (C) Original magnification, ×10. (D) qRT-PCR demonstrating expression of proinflammatory genes in the small intestine of P. UF1–gavaged or untreated newborn mice subjected to NEC-like injury. Control newborn mice (PBS) with no NEC-like injury. (E and F) Representative data of flow plots, percentages, and total cell counts of IL-1β+, IL-6+, IL-12/23p40+, IL-10+, and TGF-β+ DCs (E), IL-10+ Th17 cells, and IL-10+ TGF-β+ Tregs (F) in the indicated groups. Data are pooled from 3 experiments in steady state (n = 15 newborn mice/group, A) and for NEC-like injury (PBS, n = 10 newborn mice; NEC, n = 12 newborn mice; NEC + P. UF1, n = 17 newborn mice, E) or 4 experiments (NEC, n = 33 newborn mice; NEC + P. UF1, n = 30 newborn mice, B). Error bars represent mean ± SEM. *P < 0.05; **P < 0.01; ***P < 0.001; ****P < 0.0001, 2-tailed unpaired t test (A and B) or Kruskal-Wallis test (DF).

Similar articles

Cited by

References

    1. Goldenberg RL, Culhane JF, Iams JD, Romero R. Epidemiology and causes of preterm birth. Lancet. 2008;371(9606):75–84. doi: 10.1016/S0140-6736(08)60074-4. - DOI - PMC - PubMed
    1. Romero R, Espinoza J, Gonçalves LF, Kusanovic JP, Friel L, Hassan S. The role of inflammation and infection in preterm birth. Semin Reprod Med. 2007;25(1):21–39. doi: 10.1055/s-2006-956773. - DOI - PMC - PubMed
    1. Groer MW, Luciano AA, Dishaw LJ, Ashmeade TL, Miller E, Gilbert JA. Development of the preterm infant gut microbiome: a research priority. Microbiome. 2014;2:38. - PMC - PubMed
    1. Lim JC, Golden JM, Ford HR. Pathogenesis of neonatal necrotizing enterocolitis. Pediatr Surg Int. 2015;31(6):509–518. doi: 10.1007/s00383-015-3697-9. - DOI - PubMed
    1. Besner GE. A pain in the NEC: research challenges and opportunities. J Pediatr Surg. 2015;50(1):23–29. doi: 10.1016/j.jpedsurg.2014.10.024. - DOI - PubMed

MeSH terms

Substances