. 2017 Oct 15;144(20):3731-3743.
doi: 10.1242/dev.151654. Epub 2017 Sep 21.

The eutheria-specific miR-290 cluster modulates placental growth and maternal-fetal transport

Affiliations

The eutheria-specific miR-290 cluster modulates placental growth and maternal-fetal transport

Alireza Paikari et al. Development. .

Abstract

The vertebrate-specific ESCC microRNA family arises from two genetic loci in mammals: miR-290/miR-371 and miR-302. The miR-302 locus is found broadly among vertebrates, whereas the miR-290/miR-371 locus is unique to eutheria, suggesting a role in placental development. Here, we evaluate that role. A knock-in reporter for the mouse miR-290 cluster is expressed throughout the embryo until gastrulation, when it becomes specifically expressed in extraembryonic tissues and the germline. In the placenta, expression is limited to the trophoblast lineage, where it remains highly expressed until birth. Deletion of the miR-290 cluster gene (Mirc5) results in reduced trophoblast progenitor cell proliferation and a reduced DNA content in endoreduplicating trophoblast giant cells. The resulting placenta is reduced in size. In addition, the vascular labyrinth is disorganized, with thickening of the maternal-fetal blood barrier and an associated reduction in diffusion. Multiple mRNA targets of the miR-290 cluster microRNAs are upregulated. These data uncover a crucial function for the miR-290 cluster in the regulation of a network of genes required for placental development, suggesting a central role for these microRNAs in the evolution of placental mammals.

Keywords: Mouse; Placenta; Placentation; Trophoblast; miR-290; miR-371; microRNA.


Conflict of interest statement

Competing interestsThe authors declare no competing or financial interests.

Figures
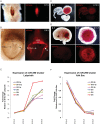
Fig. 1.
Fig. 1.
miR-290 cluster expression becomes localized to extraembryonic tissues following gastrulation. (A) At E7.5, the miR-290-mCherry reporter (red) is expressed in both embryonic and extraembryonic tissue. (B) At E8.5, the miR-290 mCherry reporter (red) is strongly expressed in yolk sac, chorion and ectoplacental cone, but not in the embryo. (C,D) At E10.5 and E15.5, miR-290 mCherry reporter (red) continues to be expressed in placenta and yolk sac but not in the embryo. (E,F) qRT-PCR results showing that miR-290 cluster expression changes in yolk sac and placental labyrinth at different time points, normalized to Sno202. B.F, bright field; EPC, ectoplacental cone; Ch, chorion; YS, yolk sac. Scale bars: 100 μm.
Fig. 2.
Fig. 2.
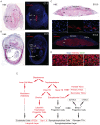
miR-290 cluster expression becomes localized to the trophoblast cells of the labyrinth and parietal TGC layers of the placenta. (A,B) H&E and immunofluorescent staining for miR-290-mCherry reporter at E7.5 and E9.5. At E7.5, the reporter is expressed strongly in extraembryonic tissue and also in embryonic tissue, whereas at E9.5 it is only expressed in extraembryonic tissues. (C) H&E and immunofluorescent staining for mCherry reporter of fully mature E18.5 placenta. It is expressed in labyrinth and parietal TGCs but not in the spongiotrophoblast cell layer. The boxed region is magnified above, showing single channels and merge. (D) The miR-290 cluster is expressed in trophoblast-derived cells of the labyrinth, whereas allantois-derived CD31+ endothelial cells are negative miR-290 cluster expression. DAPI (left), CD31 (middle) and merge (right) are shown with mCherry. (E) Ontogeny of cells expressing the miR-290 cluster during extraembryonic tissue formation. Red denotes expression of the miR-290 cluster in that cellular compartment. EXT, extraembryonic tissue; ET, embryonic tissue; EPC, ectoplacental cone; Ch, chorion; YS, yolk sac; CP, chorionic plate; La, labyrinth; Sp, spongiotrophoblast layer; TGCs, trophoblast giant cells; TE, trophectoderm; spTGCs, spiral artery TGCs; cTGCs, canal TGC; TCs, trophoblast cells; sTGCs, sinusoidal TGCs; Syn, syncytiotrophoblast cells. Scale bars: 100 μm.
Fig. 3.
Fig. 3.
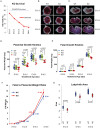
A decrease in placenta size precedes reduction in embryo size in miR-290 cluster knockouts. (A) Survival curve for miR-290 cluster knockout (KO) embryos during development determined as a ratio to all embryos (heterozygous mating). n>60 for each time point. (B,C) Bright-field images comparing the gross morphology of wild-type and miR-290 cluster knockout embryos and placentas at different developmental stages after mid-gestation. (D,E) Quantification of wild-type and miR-290 cluster knockout placenta and fetal weights. Error bars represent s.d. Line within the bars denotes mean. (F) Fetal-to-placental weight ratio during the second half of pregnancy. n>30 for each time point. Error bars represent mean±s.d. (G) Quantification of labyrinth area in wild-type and miR-290 cluster knockout placentas. n>3 placentas for each time point, and at least three sections per placenta. Upper and lower whiskers represent max and min, and middle line denotes the median. Scale bar: 1 mm.
Fig. 4.
Fig. 4.
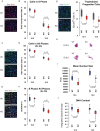
Labyrinth trophoblast progenitor cells exit the cell cycle prematurely and parietal TGCs show reduced endoreduplication in miR-290 cluster knockouts. (A) BrdU incorporation staining of E12.5 labyrinth. (B) Percentage of BrdU+ cells of the labyrinth in wild-type and miR-290 cluster knockout placentas. (C) Ki67 staining of E12.5 labyrinth. (D) Percentage of Ki67+ cells of the labyrinth in wild-type and miR-290 cluster knockout placentas. (E) BrdU and Ki67 co-staining of E12.5 labyrinth. (F) BrdU+/Ki67+ cell ratio in wild-type and miR-290 cluster knockout placentas. (B,D,F) n>3 placentas for each time point, at least three sections per placenta; cells are counted in at least 20 high-power fields (HPFs), randomly selected, in each section. (G) Epcam staining of E12.5 labyrinth. Epcamhi cells are arranged in clusters in labyrinths of wild-type and miR-290 cluster knockout placenta. n>3 placentas for each time point, at least three sections per placenta; cells are counted in at least 20 fields (20× objective lens), randomly selected, in each section. (H) Feulgen staining of parietal TGCs of wild-type and miR-290 cluster knockout placentas at E12.5 and E15.5. (I,J) Size and integrated optical density of parietal TGCs in wild-type and miR-290 cluster knockout placentas. n>3 placentas for each time point, at least three sections per placenta. All upper and lower whiskers represent max and min, and all middle lines denote median. Scale bars: 100 μm.
Fig. 5.
Fig. 5.
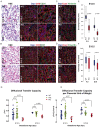
miR-290 cluster knockout labyrinth is disorganized and has reduced exchange area and diffusion capacity. (A,B) Staining of fetal and maternal vasculature in E12.5 and E15.5 labyrinths. CD31 stains endothelial cells surrounding fetal vasculature. CK8 stains the epithelial cells surrounding the maternal vasculature. Arrows indicate cell aggregates between vessels. The boxed region is magnified to the right. (C,D) Staining of fetal and maternal vasculature in E12.5 and E15.5 labyrinths. Vimentin stains endothelial cells surrounding fetal vasculature. E-cadherin stains the epithelial cells surrounding the maternal vasculature. (E,F) Quantification of exchange surface area in labyrinth of E12.5 and E15.5 placentas. n>3 placentas for each time point, at least five sections per placenta. Upper and lower whiskers represent max and min, and middle line denotes median. F.V, fetal vasculature; M.V, maternal vasculature. (G) Quantification of diffusion capacity of placenta as measured by transfer of 51Cr-EDTA from maternal blood to embryo. (H) Diffusion capacity normalized to placental weight. (G,H) Error bars represent s.d., and line within the bars denotes mean. dpc, days post coitus. Scale bars: 100 μm.
Fig. 6.
Fig. 6.
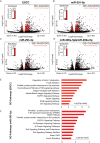
Many miR-290 cluster targets are upregulated in the knockout placental labyrinth at E10.5. (A-D) RNA-Seq results. Volcano plots showing fold change and significance values for the four distinct seed families produced by the miR-290 cluster. Targets for each seed family, as predicted by TargetScan, are highlighted in red. Inset bar charts show enrichment P-values for miRNA targets among the upregulated and downregulated genes. (E,F) Top ten GO terms identified by Enrichr for genes that are upregulated and have a seed match to the ESCC (E) or miR-293-3p (F) family. SS, seed sequence; Up, upregulated target; Down, downregulated targets.

Similar articles

Cited by

References

    1. Bartel D. P. (2009). MicroRNAs: target recognition and regulatory functions. Cell 136, 215-233. 10.1016/j.cell.2009.01.002 - DOI - PMC - PubMed
    1. Belair C. D., Paikari A., Moltzahn F., Shenoy A., Yau C., Dall'Era M., Simko J., Benz C. and Blelloch R. (2015). DGCR8 is essential for tumor progression following PTEN loss in the prostate. EMBO Rep. 16, 1219-1232. 10.15252/embr.201439925 - DOI - PMC - PubMed
    1. Biesterfeld S., Beckers S., Del Carmen Villa Cadenas M. and Schramm M. (2011). Feulgen staining remains the gold standard for precise DNA image cytometry. Anticancer Res. 31, 53-58. - PubMed
    1. Bray N. L., Pimentel H., Melsted P. and Pachter L. (2016). Near-optimal probabilistic RNA-seq quantification. Nature Biotechnol. 34, 525-527. 10.1038/nbt.3519 - DOI - PubMed
    1. Chaddha V., Viero S., Huppertz B. and Kingdom J. (2004). Developmental biology of the placenta and the origins of placental insufficiency. Semin. Fetal. Neonatal. Med. 9, 357-369. 10.1016/j.siny.2004.03.006 - DOI - PubMed

Publication types