. 2017 Sep 13;7(1):11469.
doi: 10.1038/s41598-017-11664-5.

Protective efficacy of phosphodiesterase-1 inhibition against alpha-synuclein toxicity revealed by compound screening in LUHMES cells

Affiliations

Protective efficacy of phosphodiesterase-1 inhibition against alpha-synuclein toxicity revealed by compound screening in LUHMES cells

Matthias Höllerhage et al. Sci Rep. .

Abstract

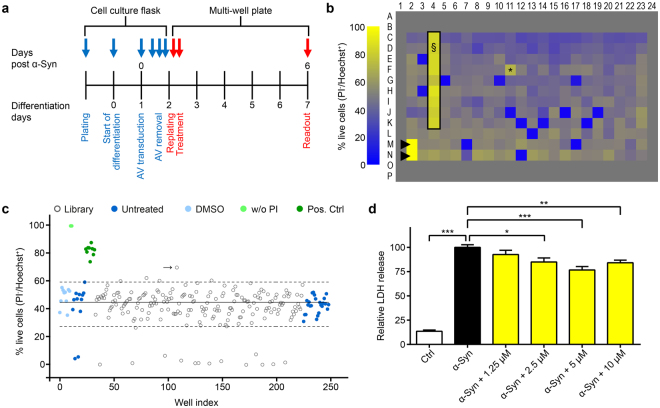
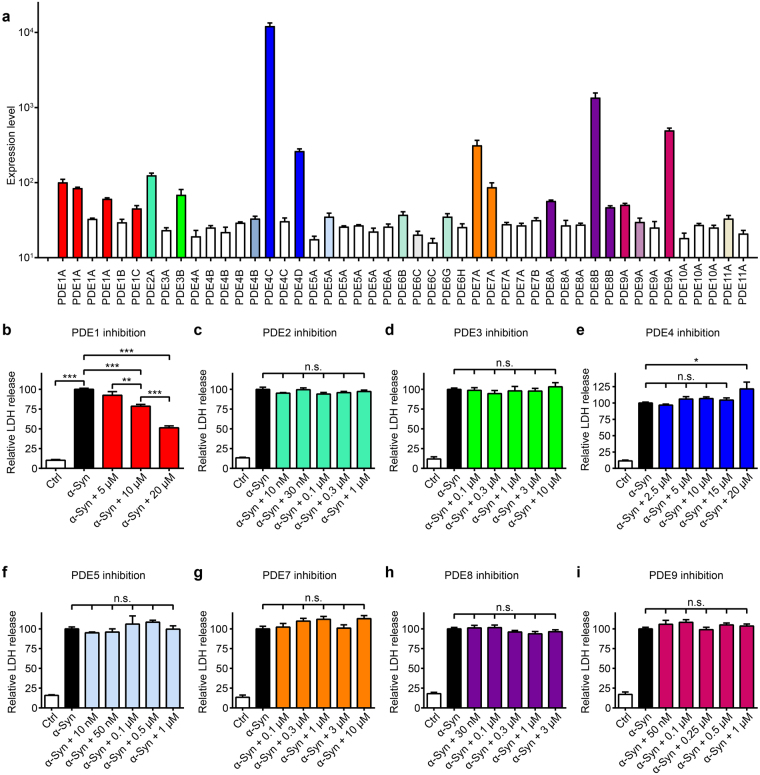
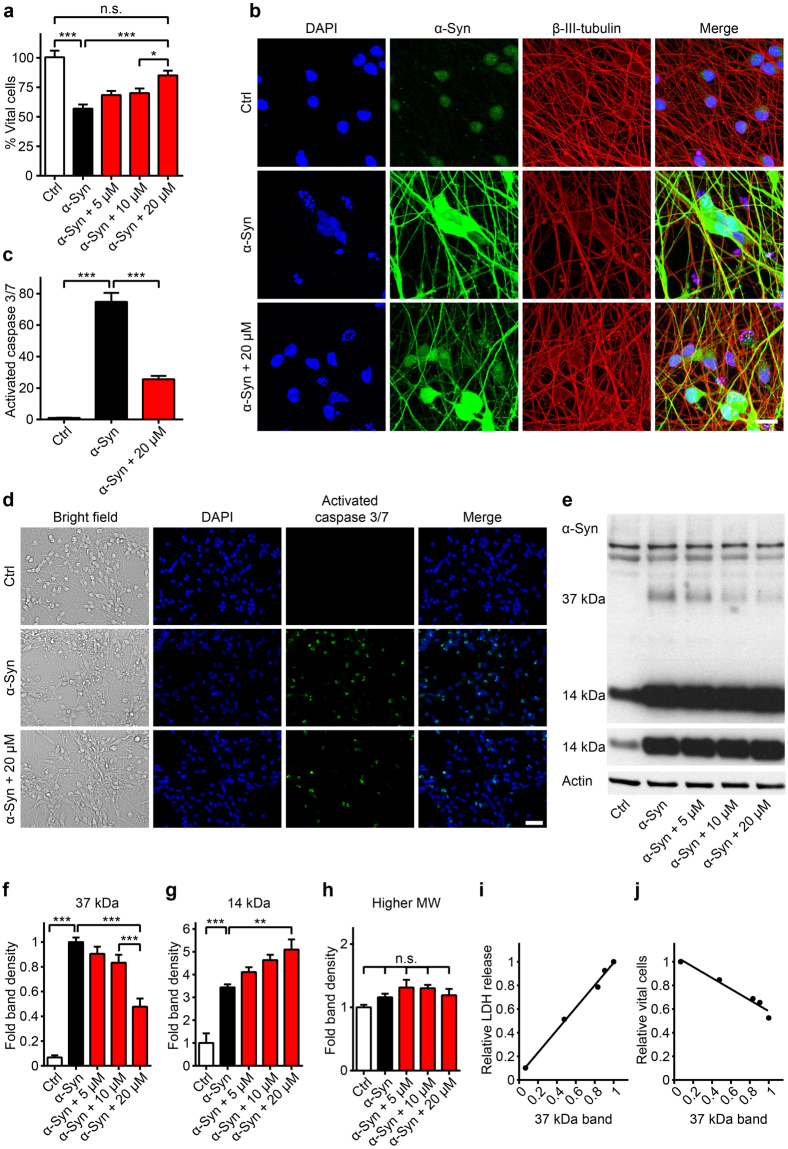
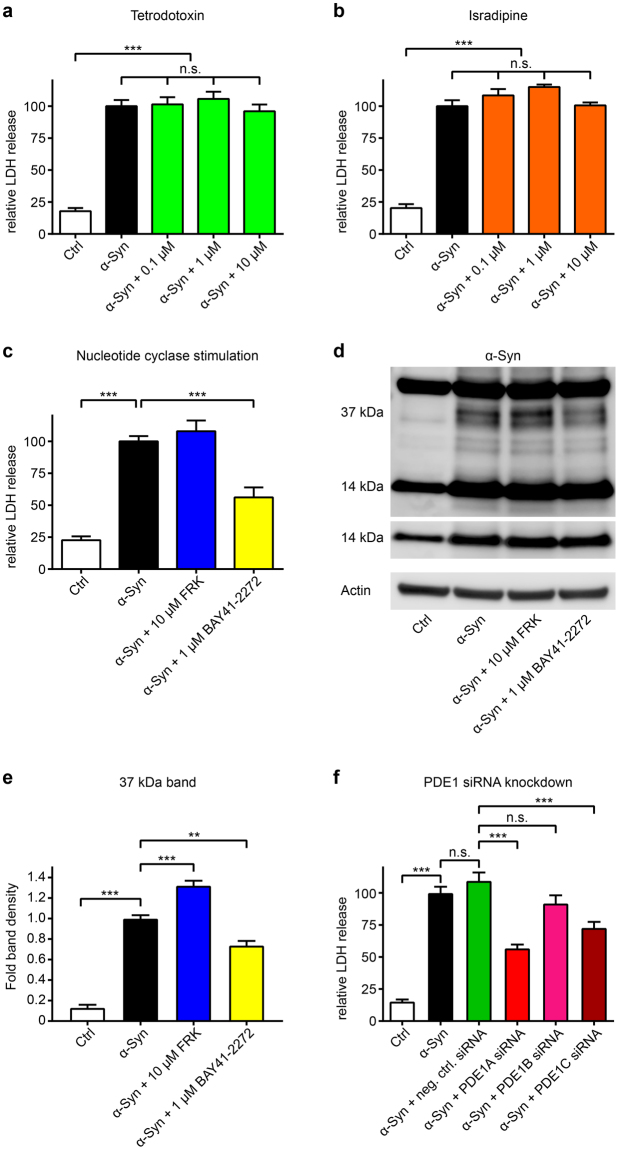
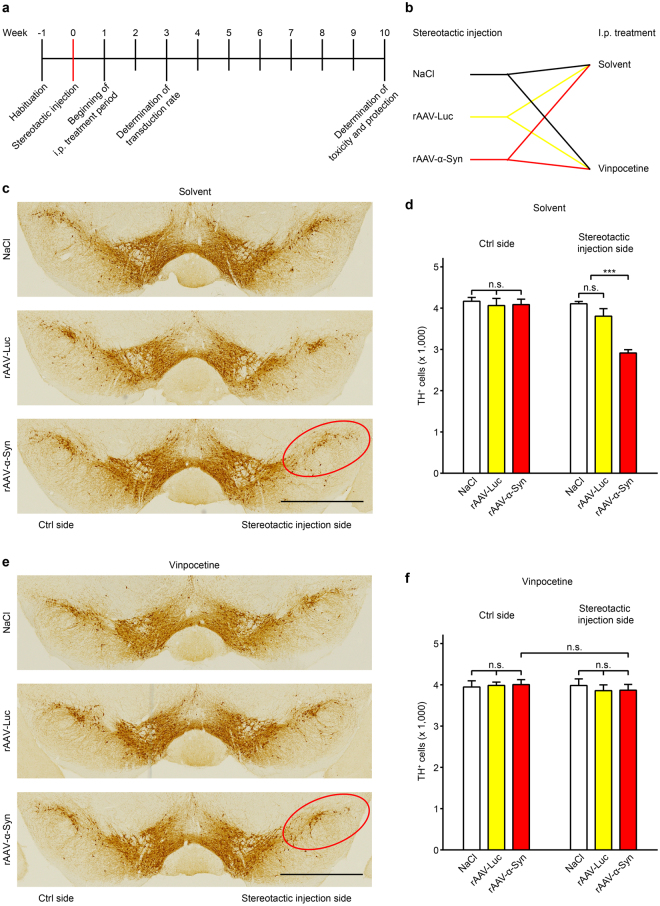
α-synuclein-induced neurotoxicity is a core pathogenic event in neurodegenerative synucleinopathies such as Parkinson's disease, dementia with Lewy bodies, or multiple system atrophy. There is currently no disease-modifying therapy available for these diseases. We screened 1,600 FDA-approved drugs for their efficacy to protect LUHMES cells from degeneration induced by wild-type α-synuclein and identified dipyridamole, a non-selective phosphodiesterase inhibitor, as top hit. Systematic analysis of other phosphodiesterase inhibitors identified a specific phosphodiesterase 1 inhibitor as most potent to rescue from α-synuclein toxicity. Protection was mediated by an increase of cGMP and associated with the reduction of a specific α-synuclein oligomeric species. RNA interference experiments confirmed PDE1A and to a smaller extent PDE1C as molecular targets accounting for the protective efficacy. PDE1 inhibition also rescued dopaminergic neurons from wild-type α-synuclein induced degeneration in the substantia nigra of mice. In conclusion, this work identifies inhibition of PDE1A in particular as promising target for neuroprotective treatment of synucleinopathies.


Conflict of interest statement

G.U.H., M.H., and T.W.R. applied for a patent describing PDE1 inhibition as therapeutical approach for synucleinopathies.

Figures

Figure 1
Figure 1
High-throughput screening of 1,600 FDA-approved drugs for modulators of α-Syn toxicity in postmitotic human dopaminergic mesencephalic LUHMES neurons. (a) Experimental design. Cells were first transduced in culture flasks (blue arrows), then transferred for screening to multi-well plates (red arrows). AV = adenoviral vectors encoding wild type α-Syn. (b) Representative heat map showing cell survival of α-Syn transduced neurons in colour codes ranging from yellow (100% survival) to blue (0% survival). The outermost (grey) wells contained no cells. Hoechst 33342 was used to label all cells, propidium iodide (PI) to label dead cells only. Survival rates were quantified as percentage of PI cells of all Hoechst+ cells. PI was omitted in the two wells marked with ▶(100% survival controls). The black frame (§) denotes wells treated with a previously identified protective compound (positive control). *Denotes a hit compound providing neuroprotection. (c) Representative scatterplot showing cell survival of b quantitatively. Continuous line: mean survival of α-Syn transduced neurons. Upper dashed line: Z-score of +2.5 (threshold for positive hits). Lower dashed line: Z-score of −3 (threshold for negative hits). Bright blue dots: wells treated with solvent (DMSO) only. Bright green dots: wells without PI. Dark blue dots: wells without treatment. Dark green dots: wells treated with a protective compound (positive control). Blank dots: wells treated with compounds from the library. →: hit compound (corresponding to * in b). (d) Concentration-dependent protective efficacy of the top hit dipyridamole against α-Syn-induced toxicity, measured by LDH release. Blank column: untransduced cells (Ctrl). Black column: α-Syn overexpressing cells without treatment. Yellow columns: α-Syn overexpressing cells treated with 1.25 µM to 10 µM of dipyridamole. *P < 0.05, **P < 0.01, ***P < 0.001, one-way ANOVA with Tukey’s HSD post-hoc test. N > 12, F = 97.74, degrees of freedom = 96. Data are mean ± SEM.
Figure 2
Figure 2
Phosphodiesterase (PDE) 1 inhibition protects against α-Syn toxicity. (a) Expression of the known PDE isoforms in LUHMES neurons four days after transduction with α-Syn. Bars in bright colours indicate PDEs with solid expression (detection p-value < 0.05 in all three samples). Blank bars indicate PDEs below the detection threshold (p-detection value < 0.05 in none of the samples). Pale bars indicate inconstant expression levels (detection p-value < 0.05 in one or two of three samples). Each bar represents a probe sequence on the Illumina chip that was assigned to a PDE. (bi) Efficacy of different PDE inhibitors to prevent α-Syn-induced cell death was measured by LDH release. Data indicate untransduced control neurons (Ctrl, white bars), neurons overexpressing α-Syn treated with solvent only (black bars), or with different PDE inhibitors in their pharmacologically active range of concentrations (coloured bars): PDE1: vinpocetine, PDE2: Bay60-7550, PDE3: milrinone, PDE4: rolipram, PDE5: sildenafil, PDE7: BRL50481, PDE8: PF-4957325-00, PDE9: Bay73-6691. Only vinpocetine protected from α-Syn-induced toxicity. Data are normalized to LDH release in α-Syn-transduced cells with solvent treatment. *P < 0.05, **P < 0.01, ***P < 0.001, n.s. not significant, one-way ANOVA with Tukey’s HSD post-hoc test. N-values, F-values and degrees of freedom (DF): (b) N ≥ 24, F = 215.3 DF = 127, (c) N = 3, F = 300.7, DF = 14, (d) N = 9, F = 71.52, DF = 56, (e) N ≥ 9, F = 62.27, DF = 74, (f) N = 3, F = 47.23, DF = 14, (g) N = 9, F = 90.41, DF = 56, (h) N ≥ 9, F = 224.3, DF = 128, (i) N ≥ 9, F = 124.2, DF = 71. Data are mean ± SEM.
Figure 3
Figure 3
The PDE1 inhibitor vinpocetine reduces cell death and a 37 kDa α-Syn species. (a) Counts of vital, i.e. non-clumped, non-fragmented 4′,6-diamidino-2-phenylindole (DAPI)-stained nuclei in untransduced control neurons (Ctrl, white bar), α-Syn transduced neurons (black bar) treated with solvent only, and α-Syn transduced neurons treated with different concentrations of vinpocetine (red bars) confirmed the compound’s protective efficacy. (b) Confocal microscopy images of untransduced control neurons, α-Syn-transduced neurons treated with solvent, and α-Syn-transduced neurons treated with vinpocetine six days after transduction, stained with DAPI (blue), an α-Syn-antibody (green), and a β-III-tubulin-antibody to demonstrate the axonal network (red). Scale bar: 20 µm. (c) Quantification of the activated caspases signal after CellEventTM staining in untransduced control neurons (left bar), α-Syn-transduced neurons treated with solvent (black bar), and α-Syn-transduced neurons treated with vinpocetine (red bar) showing activation of caspases 3 and 7 in α-Syn overexpressing neurons, which was reduced by treatment with 20 µM vinpocetine. (d) Representative images of the CellEventTM staining. Scale bar 50 µm. (e) Representative Western blot with an α-Syn antibody (C20, Santa Cruz) in lysates of control neurons and α-Syn-transduced neurons treated with solvent or with vinpocetine at different concentrations. The upper panel shows a higher exposed image, the lower panel shows a lower exposed image. (f,g) Quantification of specific α-Syn Western blot bands showed that vinpocetine reduced a 37 kDa α-Syn band (f) increased the monomer α-Syn band (g), but did not change other α-Syn bands (h). The density of the 37 kDa band positively correlated with the LDH release (r 2 = 0.99, P < 0.001, i) and negatively correlated with the number of vital cells (r 2 = 0.96, P < 0.01, j). *P < 0.05, **P < 0.01, ***< 0.001, n.s. not significant, one-way ANOVA with Tukey’s HSD post-hoc test. N-values, F-values and degrees of freedom (DF): (a) N ≥ 56, F = 15.71, DF = 351, (c) N = 9, F = 115.9, DF = 24, (f) N ≥ 6, F = 45.91, DF = 34, (g) N ≥ 6, F = 23.59, DF = 34, (h) N ≥ 6, F = 2.46, DF = 34. Data are mean ± SEM. Full length Western blots are shown in Supplementary Fig. S5.
Figure 4
Figure 4
Mechanisms of action relevant for vinpocetine’s efficacy. (ad) LDH release was used to measure degeneration in untransduced control neurons (Ctrl, white bars), α-Syn-transduced neurons treated with solvent (black bars), and α-Syn-transduced neurons with different interventions (coloured bars). The sodium channel blocker tetrodotoxin (a, green bars) and the L-type calcium channel blocker isradipine (b, orange bars) in different concentrations did not protect against α-Syn-incuded toxicity. The adenylate cyclase stimulator forskolin (c, FRK, blue bar) did also not protect, but the guanylate cyclase stimulator BAY41-2272 did (c, yellow bar). (d) Western blot with an α-Syn antibody (C20, Santa Cruz) of untransduced control neurons (Ctrl), α-Syn-transduced neurons treated with solvent (second lane), and α-Syn-transduced neurons with forskolin (FRK) or BAY41-2272 showed that BAY41-2272 treatment also led to a reduction of a 37 kDa α-Syn band, while forskolin led to an increase of this band. (e) Quantification of the 37 kDa band. (f) A negative control siRNA (green bar) and siRNA against PDE1B (pink bar) did not protect, but siRNA against PDE1A (bright red bar) was strongly protective, and siRNA against PDE1C (dark red bar) was moderately protective. *P < 0.05, **P < 0.01, ***P < 0.001, n.s. not significant, one-way ANOVA with Tukey’s HSD post-hoc test. N-values, F-values and degrees of freedom (DF): (a) N = 7, F = 116.1, DF = 30, (b) N = 6, F = 56.97, DF = 25, (c) N = 9, F = 40.5, DF = 32, (d), N = 4, F = 168.4, DF = 12, (f) N ≥ 9, F = 69.79, DF = 92. Data are mean ± SEM. Full length Western blots are shown in Supplementary Fig. S6.
Figure 5
Figure 5
Vinpocetine protects against α-Syn-induced neurotoxicity in mice in vivo. (a) Experimental timeline and (b) experimental groups. Mice were injected stereotactically with either 0.9% NaCl (control injection) or recombinant adeno-associated viruses (rAAV) to overexpress the control protein luciferase (rAAV-Luc) or α-Syn (rAAV-α-Syn). Animals of each group were then randomized to be treated with once daily i.p. injections of either solvent or vinpocetine for a 9-week period. (c) Representative images of the substantia nigra, immunostained for tyrosine hydroxylase (TH, brown) to identify dopaminergic neurons in solvent-treated mice. Red ellipse: area of cell loss upon α-Syn overexpression. (d) Stereological quantification of the number of TH+ cells on the control (Ctrl) side and the stereotactic injection side of solvent treated mice. On the injection side, there was a significant loss of TH+ cells (red bar, right panel) after α-Syn overexpression. (e) Representative images of the TH+ substantia nigra of vinpocetine treated mice of the three injection groups. Red ellipse: in contrast to solvent treated mice, vinpocetine treated mice showed no loss of TH+ neurons upon α-Syn overexpression. (f) Quantification of the number of TH+ cells on the control side and the stereotactic injection side of vinpocetine treated mice. Vinpocetine completely prevented α-Syn-induced cell death. *P < 0.05, ***P < 0.001, n.s. not significant, two-way ANOVA with Tukey’s HSD post-hoc test. N-values, F-values, degrees of freedom (DF), and P-values: (d) N = 5 (NaCl groups), N = 7 (rAAV-Luc groups), N = 11 (rAAV-α-Syn groups), interaction: F = 10.79 DF = 40, P = 0.0002, i.p. treatment: F = 18.95, DF = 40, P < 0.0001, overexpression: F = 12.31, DF = 40, P < 0.0001. (e) N = 5 (NaCl groups), N = 6 (rAAV-Luc groups), N = 14 (rAAV-α-Syn groups), interaction: F = 0.16, DF = 44, P = 0.85, i.p. treatment: F = 0.32, DF = 44, P = 0.57, overexpression: F = 0.03, DF = 44, P = 0.97. Data are mean ± SEM. Scale bars: 1 mm.

Similar articles

Cited by

References

    1. Gibb WR, Lees AJ. The relevance of the Lewy body to the pathogenesis of idiopathic Parkinson’s disease. Journal of neurology, neurosurgery, and psychiatry. 1988;51:745–752. doi: 10.1136/jnnp.51.6.745. - DOI - PMC - PubMed
    1. Fox SH, et al. The Movement Disorder Society Evidence-Based Medicine Review Update: Treatments for the motor symptoms of Parkinson’s disease. Movement disorders: official journal of the Movement Disorder Society. 2011;26(Suppl 3):41. - PubMed
    1. Braak H, et al. Staging of the intracerebral inclusion body pathology associated with idiopathic Parkinson’s disease (preclinical and clinical stages) Journal of neurology. 2002;249(Suppl 3):3–5. - PubMed
    1. Spillantini MG, et al. Alpha-synuclein in Lewy bodies. Nature. 1997;388:839–840. doi: 10.1038/42166. - DOI - PubMed
    1. Bendor JT, Logan TP, Edwards RH. The function of α-synuclein. Neuron. 2013;79:1044–1066. doi: 10.1016/j.neuron.2013.09.004. - DOI - PMC - PubMed

Publication types

MeSH terms