SOCS1 is an inducible negative regulator of interferon λ (IFN-λ)-induced gene expression in vivo
- PMID: 28900038
- PMCID: PMC5663890
- DOI: 10.1074/jbc.M117.788877
SOCS1 is an inducible negative regulator of interferon λ (IFN-λ)-induced gene expression in vivo
Abstract
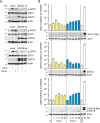
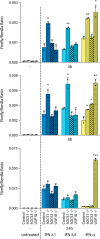
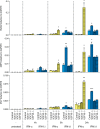
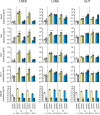
Type I (α and β) and type III (λ) IFNs are induced upon viral infection through host sensory pathways that activate IFN regulatory factors (IRFs) and nuclear factor κB. Secreted IFNs induce autocrine and paracrine signaling through the JAK-STAT pathway, leading to the transcriptional induction of hundreds of IFN-stimulated genes, among them sensory pathway components such as cGAS, STING, RIG-I, MDA5, and the transcription factor IRF7, which enhance the induction of IFN-αs and IFN-λs. This positive feedback loop enables a very rapid and strong host response that, at some point, has to be controlled by negative regulators to maintain tissue homeostasis. Type I IFN signaling is controlled by the inducible negative regulators suppressor of cytokine signaling 1 (SOCS1), SOCS3, and ubiquitin-specific peptidase 18 (USP18). The physiological role of these proteins in IFN-γ signaling has not been clarified. Here we used knockout cell lines and mice to show that IFN-λ signaling is regulated by SOCS1 but not by SOCS3 or USP18. These differences were the basis for the distinct kinetic properties of type I and III IFNs. We found that IFN-α signaling is transient and becomes refractory after hours, whereas IFN-λ provides a long-lasting IFN-stimulated gene induction.
Keywords: Hepatitis C virus (HCV); IFN λ; JAK; STAT transcription factor; interferon; suppressor of cytokine signaling 3 (SOCS3).
© 2017 by The American Society for Biochemistry and Molecular Biology, Inc.
Conflict of interest statement
The authors declare that they have no conflicts of interest with the contents of this article
Figures


Similar articles
-
Type III Interferon Induces Distinct SOCS1 Expression Pattern that Contributes to Delayed but Prolonged Activation of Jak/STAT Signaling Pathway: Implications for Treatment Non-Response in HCV Patients.PLoS One. 2015 Jul 20;10(7):e0133800. doi: 10.1371/journal.pone.0133800. eCollection 2015. PLoS One. 2015. PMID: 26193702 Free PMC article.
-
HOIL1 Is Essential for the Induction of Type I and III Interferons by MDA5 and Regulates Persistent Murine Norovirus Infection.J Virol. 2018 Nov 12;92(23):e01368-18. doi: 10.1128/JVI.01368-18. Print 2018 Dec 1. J Virol. 2018. PMID: 30209176 Free PMC article.
-
Oncostatin M induces RIG-I and MDA5 expression and enhances the double-stranded RNA response in fibroblasts.J Cell Mol Med. 2017 Nov;21(11):3087-3099. doi: 10.1111/jcmm.13221. Epub 2017 May 30. J Cell Mol Med. 2017. PMID: 28560754 Free PMC article.
-
SOCS, Intrinsic Virulence Factors, and Treatment of COVID-19.Front Immunol. 2020 Oct 23;11:582102. doi: 10.3389/fimmu.2020.582102. eCollection 2020. Front Immunol. 2020. PMID: 33193390 Free PMC article. Review.
-
Induction and regulation of IFNs during viral infections.J Interferon Cytokine Res. 2004 Aug;24(8):439-54. doi: 10.1089/1079990041689665. J Interferon Cytokine Res. 2004. PMID: 15320958 Review.
Cited by
-
Lack of Activation Marker Induction and Chemokine Receptor Switch in Human Neonatal Myeloid Dendritic Cells in Response to Human Respiratory Syncytial Virus.J Virol. 2019 Oct 29;93(22):e01216-19. doi: 10.1128/JVI.01216-19. Print 2019 Nov 15. J Virol. 2019. PMID: 31484754 Free PMC article.
-
TDRD3 is an antiviral restriction factor that promotes IFN signaling with G3BP1.PLoS Pathog. 2022 Jan 27;18(1):e1010249. doi: 10.1371/journal.ppat.1010249. eCollection 2022 Jan. PLoS Pathog. 2022. PMID: 35085371 Free PMC article.
-
Impact of Obesity on Influenza A Virus Pathogenesis, Immune Response, and Evolution.Front Immunol. 2019 May 10;10:1071. doi: 10.3389/fimmu.2019.01071. eCollection 2019. Front Immunol. 2019. PMID: 31134099 Free PMC article. Review.
-
Exosomal Interferon-Induced Transmembrane Protein 2 Transmitted to Dendritic Cells Inhibits Interferon Alpha Pathway Activation and Blocks Anti-Hepatitis B Virus Efficacy of Exogenous Interferon Alpha.Hepatology. 2019 Jun;69(6):2396-2413. doi: 10.1002/hep.30548. Epub 2019 Apr 10. Hepatology. 2019. PMID: 30723923 Free PMC article.
-
Excessive negative regulation of type I interferon disrupts viral control in individuals with Down syndrome.Immunity. 2022 Nov 8;55(11):2074-2084.e5. doi: 10.1016/j.immuni.2022.09.007. Epub 2022 Oct 14. Immunity. 2022. PMID: 36243008 Free PMC article.
References
-
- Darnell J. E., Jr. (1997) STATs and gene regulation. Science 277, 1630–1635 - PubMed
-
- Krebs D. L., and Hilton D. J. (2001) SOCS proteins: negative regulators of cytokine signaling. Stem Cells 19, 378–387 - PubMed
-
- Dill M. T., Makowska Z., Trincucci G., Gruber A. J., Vogt J. E., Filipowicz M., Calabrese D., Krol I., Lau D. T., Terracciano L., van Nimwegen E., Roth V., and Heim M. H. (2014) Pegylated IFN-alpha regulates hepatic gene expression through transient Jak/STAT activation. J. Clin. Invest. 124, 1568–1581 - PMC - PubMed
MeSH terms
Substances
LinkOut - more resources
Full Text Sources
Other Literature Sources
Molecular Biology Databases
Research Materials

