. 2017 Oct;19(10):1214-1225.
doi: 10.1038/ncb3610. Epub 2017 Sep 11.

Retriever is a multiprotein complex for retromer-independent endosomal cargo recycling

Affiliations

Retriever is a multiprotein complex for retromer-independent endosomal cargo recycling

Kerrie E McNally et al. Nat Cell Biol. 2017 Oct.

Abstract

Following endocytosis into the endosomal network, integral membrane proteins undergo sorting for lysosomal degradation or are retrieved and recycled back to the cell surface. Here we describe the discovery of an ancient and conserved multiprotein complex that orchestrates cargo retrieval and recycling and, importantly, is biochemically and functionally distinct from the established retromer pathway. We have called this complex 'retriever'; it is a heterotrimer composed of DSCR3, C16orf62 and VPS29, and bears striking similarity to retromer. We establish that retriever associates with the cargo adaptor sorting nexin 17 (SNX17) and couples to CCC (CCDC93, CCDC22, COMMD) and WASH complexes to prevent lysosomal degradation and promote cell surface recycling of α5β1 integrin. Through quantitative proteomic analysis, we identify over 120 cell surface proteins, including numerous integrins, signalling receptors and solute transporters, that require SNX17-retriever to maintain their surface levels. Our identification of retriever establishes a major endosomal retrieval and recycling pathway.


Conflict of interest statement

The authors declare no competing financial interests.

Figures
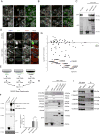
Figure 1
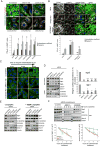
Figure 1. Comparative GFP-SNX17 and SNX17-GFP proteomics identifies the retromer-independent sorting machinery
(A, B) GFP-SNX17 and SNX17-GFP localise to early endosomes in RPE-1 transduced cells. Representative field of view from n=3. EEA1 is an early endosomal marker, LAMP1 is a late endosome/lysosomal marker. (C) GFP-SNX17 and SNX17-GFP were expressed in HEK 293 cells and GFP traps were performed. Western blot analysis verified that these constructs bind LRP1, an established SNX17 cargo. Representative blot of n=3. (D) SNX17 was suppressed in HeLa cells by siRNA before re-expression of GFP or siRNA resistant versions of GFP-SNX17 or SNX17-GFP. Representative images from n=3. See supplementary figure 1 for zoomed out images. (E) Schematic of SILAC proteomics. (F) GFP-SNX17 and SNX17-GFP transduced cells were lysed and the expression of SNX17 was analysed. GFP-SNX17 or SNX17-GFP band intensities were measured using Odyssey software and normalised to loading control and compared to endogenous SNX17 (set to 1). Differences between GFP-SNX17 and SNX17-GFP levels were tested with t-test. Quantification from n=3. Ns = non-significant. (G) Filtered proteomic data plotted as logScore versus log(SNX17-GFP enrichment/GFP-SNX17 enrichment). Each circle represents a protein of the SNX17 interactome. Proteins with a large negative log(SNX17-GFP enrichment/GFP-SNX17 enrichment) are specifically lost in the SNX17-GFP condition. The protein highlighted in red is a member of the retromer complex (VPS29), orange circles indicate proteins of the CCC complex, the purple circle represents a CCC complex associated protein (C16orf62) and a blue circle represents a protein of unknown function (DSCR3). (H) The proteomic data was validated by GFP traps and Western analysis from HEK 293 cells transiently transfected with GFP, GFP-SNX17, SNX17-GFP, GFP-VPS35 or GFP-SNX27. Representative blot of n=3. (I) Endogenous SNX17 was immunoprecipitated and the recovered material was immunoblotted for the indicated proteins. Representative blot of n=3
Figure 2
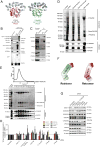
Figure 2. Suppression of SNX17, CCDC22, CCDC93, C16orf62 and DSCR3 or deletion of VPS29 but not VPS35 leads to miss-sorting of α5β1 integrin
(A) HeLa cells were transfected with siRNA targeting the indicated proteins and were fixed 72 hours post transfection. Cells were stained for α5 integrin and the lysosomal marker LAMP1. Representative fields of view from n=3. Quantification of the Pearson’s coefficient, colocalisation coefficient and significance were calculated across three independent knockdown experiments. Coefficients were compared to scramble control values by t-test. *** p<0.001, ** p<0.01. (B) VPS29 knock out results in lysosomal missorting α5β1 integrin. Parental, VPS29 KO and VPS29 KO rescue (where VPS29 was re-expressed in VPS29 KO) HeLa cells were fixed and stained for α5 integrin and the lysosomal marker LAMP1. Pearson’s and colocalization coefficients were calculated from 3 independent experiments. Coefficients were compared to parental HeLa values by t-test. *** p<0.001, ns = non-significant. (C) HeLa cells transfected with the indicated siRNA were incubated with a monoclonal antibody against β1 integrin for 30 min at 37°C. Surface bound antibody was acid stripped and followed by further incubation at 37°C for the indicated time before fixation. (D) HeLa cells were transfected with siRNA targeting the indicated proteins. Cells were biotinylated with a membrane-impermeable biotin conjugate. Cells were lysed and biotinylated proteins isolated with streptavidin sepharose followed by Western blotting. Quantification from n=3. Band intensities of cell surface proteins were measured and calculated as a % of scrambled control band intensity. Knock-down conditions were compared to scrambled control using t-test. *** p<0.001, ** p<0.01, * p<0.05. Error bars represent s.d. Quantification of band intensities was done using Odyssey software. (E) HeLa cells were knocked-down with indicated siRNA. Cells were incubated with the lysosomal inhibitor leupeptin prior to lysis. Protein levels were then analysed by Western blotting. Representative blots taken from one of three independent experiments (F) HeLa cells transfected with the indicated siRNAs were treated with the ribosomal inhibitor cycloheximide for 3, 6 and 9 hours followed by Western blot based quantification of total α5β1 integrin levels. Quantification from n=3. Quantification of Western blot was achieved on Odyssey software. Protein amounts are represented as a % of protein present at 0 hours per condition. % of protein in knock-down conditions was compared to protein % in scramble control per time point using t-test. *** p<0.001, ** p<0.01, * p<0.05.
Figure 3
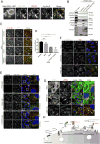
Figure 3. C16orf62, DSCR3 and VPS29 form a retromer-like heterotrimer
(A) A homology model of C16orf62, residues 717-1030, was constructed, using the published VPS35 structure as a template. For modelling details see (van Weering et al., 2012). (B) C16orf62 interacts with DSCR3 and VPS29 but not the other retromer subunits VPS35 and VPS26A. GFP traps of GFP-VPS35 or GFP-C16orf62 followed by Western analysis in HEK 293 cells. Representative blot of n=3. (C) Endogenous C16orf62 interacts with endogenous VPS29 and DSCR3. Endogenous C16orf62 immuno-precipitations in HEK 293 cells. Representative blot from n=3. (D) C16orf62, Strep-DSCR3 and VPS29-his form a complex. C16orf62, Strep-DSCR3 and VPS29-his were expressed in Sf21 insect cells using the MultiBac system (see supplementary figure 2 for details). Following lysis by sonication, cleared insect lysate was added to a column filled with Talon resin. Bound proteins were eluted with imidazole. Samples from each step of the purification were collected and analysed by SDS-PAGE followed by either Coomassie staining or Western analysis. For Coomassie staining, the lysate, soluble fraction and talon flow through lanes represent 0.05% of total protein input in the Talon column. Eluate represents 1% of eluted protein. For Western analysis, a smaller amount of protein was loaded; 0.025% from the same lysate, soluble and flow through samples were loaded and 0.5% of the total talon eluate. Representative images from n=3. (E) C16orf62, Strep-DSCR3 and VPS29-his co-elute following size exclusion chromatography. Following the VPS29-his purification shown in D, the eluate was concentrated and injected into a superdex200 size exclusion column. Fractions were collected and then analysed by SDS-PAGE followed by either Coomassie staining or Western blotting. (F) Schematic model of retriever and retromer minimal protein assemblies (G and H) Retriever is distinct to the CCC complex and retromer. HeLa cells were transfected with siRNA targeting the indicated proteins and Western blot analysis was subsequently performed. Representative blot of n=3. Band intensities were measured using the Odyssey software and normalised to their respective loading control (β-actin) before calculating the percentage protein compared to the non-targeting (scramble) siRNA control. Bars represent the average of three independent experiments. Error bars represent S.E.M.
Figure 4
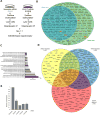
Figure 4. The retriever complex requires the CCC and WASH complexes for endosomal localisation
(A) Retriever and retromer co-localise on a retrieval subdomain distinct from the ESCRT subdomain. HeLa cells transiently transfected with Rab5 Q79L–BFP were methanol fixed and stained for the indicated endogenous proteins. A representative fields of view from n=3. For clarity the BFP channel has been excluded from the merged images and Hrs/Hrs-2 has been false coloured in blue. (B) Retriever or the CCC complex do not interact with proteins involved in endosomal recruitment of retromer. mCherry traps from HEK293 cells. Representative Western blot from n=2. (C) Retriever requires the CCC complex for endosomal localisation. HeLa cells were transfected with siRNA targeting the indicated proteins. Endogenous C16orf62 and VPS35 localisation were analysed by confocal microscopy. Representative field of view from n=3. See supplementary figure4A for lower magnification images. (D) Quantification of C. Pearson’s coefficient between C16orf62 and VPS35 under the indicated suppressions. 3 independent experiments were analysed. Total cell numbers analysed; Scr=144 cells, SNX17 =140 cells, DSCR3=146 cells, CCDC22+CCDC93=134 cells. Pearson’s coefficient values were compared to scramble control using one-way ANOVA and Dunnett test. **** p<0.0001, *** p<0.001, ns non-significant. Error bars represent s.d. (E) Endosomal localisation of retriever is independent of retromer. Parental HeLa cells along with VPS35 KO HeLa cells were fixed and stained for endogenous SNX1 as well as VPS35, FAM21 or C16orf62. Representative field of view. (F) Retriever requires FAM21 for its localisation to endosomes. Parental HeLa or KO HeLa cells for VPS35 or FAM21 were fixed and stained for endogenous localisation of C16orf62 and SNX1. Representative field of view. (G) FAM21 KO HeLa cells display a α5-integrin miss-sorting phenotype. Distribution of α5-integrin was analysed in parental HeLa cells, VPS35 KO or FAM21 KO HeLa cells. LAMP2 was used as a marker of lysosomes. Representative field of view. (H) Working model for the endosomal localisation of retriever.
Figure 5
Figure 5. The evolutionary conserved carboxy-terminal tail of SNX17 interacts with DSCR3
(A) Endogenous SNX17 immunoprecipitation and Western blot analysis in HeLa cells, including either CCDC93 or DSCR3 KO lines and DSCR3 KO cells following DSCR3 re-expression (DSCR3 KO Rescue). Representative of n=3. (B) Schematic of the domain organisation of SNX17 and truncation mutants. (C) The carboxy-terminal tail of SNX17 is required for binding to retriever. Western analysis of GFP traps from tagged SNX17 truncation mutants expressed in HEK 293 cells. Representative blot from n=3 (D) The carboxy-terminal tail of SNX17 is sufficient to engage retriever and the CCC complex. GFP traps of GFP-SNX3-SNX17 tail chimeras expressed in HEK 293 cells. Representative blot of n=3 (E) Sequence alignment of the SNX17 tail from across species. Yellow indicates high levels of sequence homology. Arrows indicate residues mutated and the black box represents the four amino acids deleted in the D467X mutant. (F) A SNX17 L470G mutation abrogates binding to retriever and the CCC complex. GFP traps and Western analysis of tagged SNX17 site-directed mutants (indicated in E) expressed in HEK 293 cells. Representative blot from n=3. (G) Quantification of (F). Band intensities were measured from n=3 using Odyssey software. Band intensities were normalised to GFP expression and are presented as the average fraction of the GFP-SNX17 control. Error bars represent S.E.M. Mutants were compared to WT using one-way ANOVA and Dunnett test. *** p<0.001, ** p<0.01, ns non-significant.
Figure 6
Figure 6. The interaction between SNX17 and DSCR3 is evolutionary conserved and essential for the endosomal sorting α5β1-integrin
(A) WT SNX17 but not SNX17 L470G can rescue the α5β1 phenotype observed in SNX17 null cells. Protein lysates from parental HeLa cells, SNX17 KO or SNX17 KO cells transduced to express untagged SNX17 or SNX17(L470G) at endogenous levels were subjected to Western blot analysis. Representative blot from n=3. (B) Total levels of α5β1-integrin from A were quantified from n=3. (C) SNX17 L470G can not rescue the lysosomal localisation of α5β1 observed in SNX17 null cells. SNX17 KO HeLa cells were transduced with untagged SNX17 or SNX17(L470G). Untransduced KO cells were used as a control. Cells were fixed and stained with DAPI and against the lysosomal marker LAMP1 and α5-integrin. Representative field of view. (D) Quantification of C. (E) The interaction between SNX17 and retriever is evolutionary conserved. GFP trap of GFP-SNX3-Drosophila-SNX17 tail and equivalent carboxy-terminal mutation (L490G) expressed in human HEK 293 cells. Representative blot of n=3.
Figure 7
Figure 7. Global, quantitative analysis of the cell surface proteome reveals that SNX17 dependent retrieval of cargo regulates integrins, cell adhesion molecules, nutrient transporters and signalling receptors
(A) Schematic of surface biotinylation coupled to SILAC based proteomics. (B) Integral proteins lost more than 1.4-fold and identified by 2 or more unique peptides. Blue circle represents integral proteins reduced in three independent experimental replicates, green circle represents proteins reduced in two. Bold and underlined proteins: established SNX17 cargo, Red proteins: cargo with NPxY motifs known to be engaged by SNX17, Purple: proteins which contain an NxxY motif in a cytosolic region. (C) Gene ontology search of (B) using Panther. (D) Comparison of integral proteins lost from the surface following SNX17 suppression in 3 independent experiments and from published studies following SNX27 or VPS35 suppression. (E) Knock-down of retriever reduces HPV infection. HPV pseudovirions, containing a luciferase reporter, were added to HaCaT cells which were suppressed for the indicated proteins. Infection was monitored 48 hours later by analysing firefly luciferase activity in cell lysates.

Comment in

Similar articles

Cited by

References

    1. Huotari J, Helenius A. Endosome maturation. EMBO J. 2011;30:3481–3500. - PMC - PubMed
    1. Gallon M, Cullen PJ. Retromer and sorting nexins in endosomal sorting. Biochem Soc Trans. 2015;43:33–47. - PubMed
    1. Schreij AM, Fon EA, McPherson PS. Endocytic membrane trafficking and neurodegenerative disease. Cell Mol Life Sci. 2016;73:1529–1545. - PMC - PubMed
    1. Henne WM, Buchkovich NJ, Emr SD. The ESCRT pathway. Dev Cell. 2011;21:77–91. - PubMed
    1. Burd C, Cullen PJ. Retromer: a master conductor of endosome sorting. Cold Spring Harb Perspect Biol. 2014;6 - PMC - PubMed

MeSH terms