. 2017 Sep 7;170(6):1134-1148.e10.
doi: 10.1016/j.cell.2017.07.034.

Distinct Mesenchymal Lineages and Niches Promote Epithelial Self-Renewal and Myofibrogenesis in the Lung

Affiliations

Distinct Mesenchymal Lineages and Niches Promote Epithelial Self-Renewal and Myofibrogenesis in the Lung

Jarod A Zepp et al. Cell. .

Abstract

The lung is an architecturally complex organ comprising a heterogeneous mixture of various epithelial and mesenchymal lineages. We use single-cell RNA sequencing and signaling lineage reporters to generate a spatial and transcriptional map of the lung mesenchyme. We find that each mesenchymal lineage has a distinct spatial address and transcriptional profile leading to unique niche regulatory functions. The mesenchymal alveolar niche cell is Wnt responsive, expresses Pdgfrα, and is critical for alveolar epithelial cell growth and self-renewal. In contrast, the Axin2+ myofibrogenic progenitor cell preferentially generates pathologically deleterious myofibroblasts after injury. Analysis of the secretome and receptome of the alveolar niche reveals functional pathways that mediate growth and self-renewal of alveolar type 2 progenitor cells, including IL-6/Stat3, Bmp, and Fgf signaling. These studies define the cellular and molecular framework of lung mesenchymal niches and reveal the functional importance of developmental pathways in promoting self-renewal versus a pathological response to tissue injury.

Keywords: Fgf; Wnt; lung; mesenchyme; organoid; regeneration.


Figures

Figure 1
Figure 1. Signaling pathway reporter activity identified distinct mesenchymal cells in the adult mouse lung
(A–D) Axin2CreERT2:tdT reporter mice express tdTomato throughout the lung mesenchyme. (E–H) Axin2-lineage traced cells shows that Axin2+ positive cells surrounding the airways rarely express Pdgfrα (E, black arrowhead) whereas they do express Pdgfrβ+ (F, white arrowhead). In contrast, Axin2+ cells in the alveolar region are predominantly Pdgfrα positive (E and G, white arrowheads) and generally do not express Pdgfrβ (H, black arrowhead). (I) Wnt2-expressing mesenchymal cells are only present in the alveolar compartment. (J and K) Immunostaining shows that Wnt2-derived cells are Pdgfrα+ (white arrowhead) and not Pdgfrβ+ (black arrowhead). (L) Wnt2creERT2:R26RtdTomato:PdgfrαEGFP mice reveal that the majority of Wnt2+ cells are PdgfrαEGFP positive. (M) Axin2CreERT2:tdT:PdgfrαEGFP mice reveal Axin2-Pα double positive and Axin2-tdT single positive cells, with the Axin2-Pα cells found primarily in the alveolar region (inset). (N) Quantification of the spatial distribution of Axin2 and PdgfrαEGFP positive cells (left graph) and quantification of the alveolar distribution of Wnt2 mesenchymal cells (right graph). (O) Schematic showing the mesenchymal populations and their general spatial distributions. Data in N are means ± SEM. Scale bars A–K low magnification are 50 µm, high magnification are 10 µm. aw=airway, v=blood vessel, asm= airway smooth muscle, pbm= peri-bronchial mesenchyme and epi=epithelium.
Figure 2
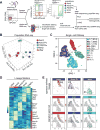
Figure 2. Lung mesenchymal cells have distinct transcriptomes
(A) Schematic of strategy to construct and compare transcriptomic data from lineage reporter popRNA-seq versus scRNA-seq. The sorting strategy for mesenchyme from Axin2CreERT2:tdT:PdgfraEGFP and Wnt2creERT2:R26REYFP traced cells is shown. Representative flow-cytometry plots are shown. (B) Three-dimensional principal component analysis (PCA) from popRNA-seq of the 5 mesenchymal populations, n=2 mice. (C) tSNE plot derived from scRNA-seq of 5,572 cells, colored by K means of 10 clustering. Clusters 1–5 were used for analysis as cluster 6–10 contained only a few cells each. (D) Heatmap of selected lineage enriched genes. An abbreviated list of genes specific for each of the five different cell populations are shown to the right of the heatmap. (E) Overlay plots of gene signatures derived from (D) projected onto the scRNA-seq reveal distinct patterns correlating with the identified lineage reporters.
Figure 3
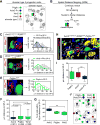
Figure 3. Spatial distance mapping to define the alveolar niche in the lung
(A) Schematic showing the alveolar niche, consisting of AT2 cells near mesenchymal cells. (B) Flow-chart for spatial distance mapping. (C–E) Representative images showing mesenchymal cell nuclei to nearest AT2 nuclei vectors from the indicated mice. Distance vectors were plotted in frequency distribution plots that show the frequency of distance relationships within 2µm bin sizes along the x-axis. (F) Average distance between each mesenchymal lineage and an AT2 cell. (G) Percent of each mesenchymal lineage population found within 10µm of an AT2 cell. (H) Reconstructed z-stack from Axin2CreERT2:tdT:R26REYFP:PdgfrαEGFP lungs indicating distances between AT2 cells (Sftpc+) and Axin2, Axin2-Pα and Pdgfrα cell lineages. (I) Average distance between each mesenchymal lineage and an AT2 cell indicates that the Axin2-Pα cell resides closest in proximity to AT2 cells. (J) Schematic showing Axin2-Pα cells are spatially distributed near Sftpc+ AT2 cells. Box and whisker plots, bars are min and max values. Asterisks * or ** indicates p<0.05, 0.01 respectively by one-way ANOVA.
Figure 4
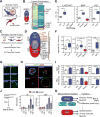
Figure 4. The mesenchymal alveolar niche cell promotes AT2 cell self-renewal and differentiation
(A) Experimental outline to test the ability of mesenchymal lineages to promote alveolar organoid growth. (B) Live SftpcCreERT2:R26REYFP labeled cells showing EYFP native fluorescence (top row) or immunostaining for the indicated markers from fixed organoids (bottom row). Scale bars= 1mm (top), 25 µm (bottom). (C) Colony forming efficiency of alveolar organoids with the different mesenchymal lineages. (D) Size of alveolar organoids. (E and F) Q-PCR data from organoid cultures shows an increased expression of the AT2 genes Sftpc and the AT1 gene Aqp5 using the Axin2-Pα MANCs. (G) Example of AT2 and AT1 cell generation in an alveolar organoid stained with the AT1 cell marker Hopx and the AT2 cell marker Sftpc. The image shown is a max projection. (H) Quantification data of the number of AT1/AT2 cells generated in each co-culture condition showing a higher ratio in the Axin2-Pα co-cultured assays. (I) Diagram modeling mesenchymal lineages and how the MANC lineage supports the alveolar niche. Representative data are shown from n=4–6 mice, box and whiskers indicate min and max, error bars are means ± SEM. Asterisks, *, ** and *** indicate p<0.05, 0.01 and 0.001 respectively by one-way ANOVA.
Figure 5
Figure 5. Myofibroblasts are derived from an Axin2+ myogenic progenitor cell
(A) Diagram showing the experimental design to determine the lineage of origin for myofibroblasts generated after bleomycin lung injury. (B–D) Axin2CreERT2:tdT lineage traced mice show robust differentiation into αSMA positive myofibroblasts, while PdgfraCreERT2 and Wnt2CreERT2 lineage traced cells often form near αSMA+ cells but are rarely αSMA+, scale bars low and high magnification are 50µm and 10µm respectively (E) Quantification of the lineage tracing from B–D. (F–G) Reduced PdgfrαEGFP expression is observed in myofibroblasts, however these cells are positive for Axin2-tdTomato. Asterisks indicate Axin2-Pα cells. Scale bar=25µm (H) Quantification of the αSMA staining in Axin2-tdTomato single positive and MANC (Axin2-Pα) cells. (I) Axin2+ and MANC cells were sorted from treated mice and Q-PCR was performed. (J) Quantification from flow cytometry data on live cells gated on mesenchyme for the AMP and MANC cells from treated Axin2CreERT2:tdT:PdgfraEGFP mice, n=3–5 mice per time point for I and J. (K and L) PdgfrαEGFP (MANC) cells co-express the proliferation marker Ki67 at day 21 post bleomycin injury. (M) Quantification of proliferation data from K–L. (N) Model diagram showing that the AMP lineage is responsive to injury by up-regulating a myofibroblast gene expression pattern. Error bars are means ± SEM, ***, ** and * indicates p<0.001, 0.01 by one-way ANOVA.
Figure 6
Figure 6. AMP cells generate airway smooth muscle following airway epithelial injury by naphthalene
(A) Axin2+ cells (red) are the predominant Axin2 lineage residing near the airway smooth muscle (ASM-brown). Axin2+/Pdgfrα+ cells (blue) comprise a small (42%) of the overall Axin2+ cells surrounding the airways. In the naphthalene injury model airway epithelial cells are selectively ablated and a Wnt-dependent ASM proliferative response occurs. (B and C) Lineage traced Axin2+ cells, EYFP-positive and αSMA was analyzed by immunostaining and quantified. (D and E) Lineage traced Pdgfrα+ cells, EYFP+ and Acta2 was analyzed by immunostaining and quantified. (F) Model diagram indicating that the Axin2+ AMP lineage generates both parabronchial smooth muscle and myofibroblasts after injury. Representative images are shown from n=3 mice per treatment group. Error bars are means ± SEM. *=p<0.05 and ***=p<0.001 by U-test. Aw=airway. Scale bars, low magnification =50µm, high magnification =10 µM.
Figure 7
Figure 7. Defining the lung alveolar niche through characterization of the MANC–specific AT2 receptome
(A) MANC cells are intimately associated with AT2 cells produce signals that likely direct AT2 growth or quiescence. (B) MANC and AMP enriched genes for secreted proteins were identified from the popRNA-seq data. The Venn diagram shows the number of unique genes and the genes listed to the right are unique to either the MANC or AMP lineage as indicated. (C) Schematic for cell type ligand/receptome analysis (D) Summary of acquired data as outlined in C, showing IL6:IL-6ST and Fgf7:Fgfr identified as unique ligand:receptor pairs in the MANC:AT2 interactions. (E) SftpcCreERT2:R26REYFP cells were combined with MANC as outlined in Figure 4 and colony forming efficiency was calculated after 21 days in culture. (F) In the same experiments, organoid size was calculated, error bars are min and max values. (G) Native EYFP fluorescence of representative wells from the control (veh) and treated AT2 cells cultured with MANCs, scale bar is 1 mm (H) Immunostaining of the organoids from the indicted treatment groups for expression of Sftpc and Aqp5, scale bar is 50µm (I) Q-PCR from the indicated conditions showing differential expression of AT1 differentiation marker Aqp5 (top row) and the AT2 cell marker Sftpc (bottom row). (J) Assessment of the in vivo relevance of MANC produced growth factors Il6 and Fgf7, showing changes due to bleomycin injury. (K) Overview model showing that regionally distributed mesenchymal lineages are distinct with MANCs spatially located next to AT2 cells to promote AT2 cell growth and differentiation while a distinct AMP lineage is poised to generate myofibroblasts following tissue damage. N=4–5 mice per condition, the same veh conditions were used for Bmp and Fgf experiments and are re-plotted for each pathway graph to aid visualization. Error bars are means ± SEM. *, **, ** are p<0.05, 0.01 and 0.001 respectively by U-test or one-way ANOVA. Scale bars=25µm.

Similar articles

Cited by

References

    1. Adamson IY, Bowden DH. The pathogenesis of bleomycin-induced pulmonary fibrosis in mice. The American journal of pathology. 1974;77:185–197. - PMC - PubMed
    1. Al Alam D, Green M, Tabatabai Irani R, Parsa S, Danopoulos S, Sala FG, Branch J, El Agha E, Tiozzo C, Voswinckel R, et al. Contrasting expression of canonical Wnt signaling reporters TOPGAL, BATGAL and Axin2(LacZ) during murine lung development and repair. PloS one. 2011;6:e23139. - PMC - PubMed
    1. Barkauskas CE, Cronce MJ, Rackley CR, Bowie EJ, Keene DR, Stripp BR, Randell SH, Noble PW, Hogan BL. Type 2 alveolar cells are stem cells in adult lung. The Journal of clinical investigation. 2013;123:3025–3036. - PMC - PubMed
    1. Bauer Y, Tedrow J, de Bernard S, Birker-Robaczewska M, Gibson KF, Guardela BJ, Hess P, Klenk A, Lindell KO, Poirey S, et al. A novel genomic signature with translational significance for human idiopathic pulmonary fibrosis. Am J Respir Cell Mol Biol. 2015;52:217–231. - PMC - PubMed
    1. Bellusci S, Henderson R, Winnier G, Oikawa T, Hogan BL. Evidence from normal expression and targeted misexpression that bone morphogenetic protein (Bmp-4) plays a role in mouse embryonic lung morphogenesis. Development. 1996;122:1693–1702. - PubMed