. 2017 Oct 10;474(20):3543-3557.
doi: 10.1042/BCJ20170548.

Post-translational modification of the interferon-gamma receptor alters its stability and signaling

Affiliations

Post-translational modification of the interferon-gamma receptor alters its stability and signaling

James D Londino et al. Biochem J. .

Abstract

The IFN gamma receptor 1 (IFNGR1) binds IFN-γ and activates gene transcription pathways crucial for controlling bacterial and viral infections. Although decreases in IFNGR1 surface levels have been demonstrated to inhibit IFN-γ signaling, little is known regarding the molecular mechanisms controlling receptor stability. Here, we show in epithelial and monocytic cell lines that IFNGR1 displays K48 polyubiquitination, is proteasomally degraded, and harbors three ubiquitin acceptor sites at K277, K279, and K285. Inhibition of glycogen synthase kinase 3 beta (GSK3β) destabilized IFNGR1 while overexpression of GSK3β increased receptor stability. We identified critical serine and threonine residues juxtaposed to ubiquitin acceptor sites that impacted IFNGR1 stability. In CRISPR-Cas9 IFNGR1 generated knockout cell lines, cellular expression of IFNGR1 plasmids encoding ubiquitin acceptor site mutations demonstrated significantly impaired STAT1 phosphorylation and decreased STAT1-dependent gene induction. Thus, IFNGR1 undergoes rapid site-specific polyubiquitination, a process modulated by GSK3β. Ubiquitination appears to be necessary for efficient IFNGR1-dependent gamma gene induction and represents a relatively uncharacterized regulatory mechanism for this receptor.

Keywords: cytokine receptors; phosphorylation/dephosphorylation; ubiquitin-proteasome system.


Conflict of interest statement

Competing Interests

The Authors declare that there are no competing interests associated with the manuscript.

Figures
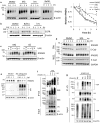
Figure 1
Figure 1. IFNGR1 is ubiquitinated and degraded by the proteasome
(a) A549 cells were treated with CHX for the indicated times in the presence of DMSO, MG132 (10 μM), bafilomycin A1 (BafA1) (100 nM) or leupeptin (Leu) (100 μM). Cells were then harvested and probed for IFNGR1 expression. Right: IFNGR1 protein densitometry normalized to β-actin and CHX 0 h to determine protein half-life. n = 3–4 independent experiments, ±SE. *P < 0.05 vs. control by ANOVA and Tukey’s t-test. (b) A549 cells were treated with EGF (100 μM) for the indicated times in the presence of DMSO, BafA1, or Leu at the concentrations above. Cells were then harvested and probed for EGFR expression. (c) A549 cells were treated with indicated concentrations of MG132 or bortezomib (BZ) for 4 h, harvested, and probed for IFNGR1 expression. (d) A549 cells were incubated with membrane impermeable biotin at 4°C, returned to the incubator and treated with DMSO or MG132 for indicated times. Cells were probed for plasma membrane (biotinylated, [Bio]) and whole cellular lysates (WCL) IFNGR1. E-cadherin was included as a plasma membrane marker, no bio = no biotinylation control. n = 2 independent experiments (e) HEK cells were transfected with HA-ubiquitin or an empty vector control. At 24 h, cells were harvested and probed for endogenous IFNGR1. The middle blot below shows levels of total cellular ubiquitination. (f) HEK cells were transfected with V5-tagged IFNGR1. At 2 and 4 h prior to harvest cells were treated with 10 μM MG132. 48 h post-transfection cell lysates were boiled, immunoprecipitated (IP) for V5, and probed for total ubiquitin, K48-linked ubiquitin, and K63-linked ubiquitin; n = 3 independent experiments. (g) HEK cells were transfected with V5-tagged IFNGR1 and Wt, lysine-less (K-R), lysine 48 only (R48K), and lysine 63 only (R63K) HA-tagged ubiquitin plasmids. At 4 h prior to harvest cells were treated with 10 μM MG132. 48 h post-transfection cell lysates were boiled, subjected to IP for V5, and probed for HA; n = 2 independent experiments.
Figure 2
Figure 2. IFN-γ treatment does not alter IFNGR1 expression
(a) Differentiated THP-1 cells were treated with 50 ng/ml IFN-γ for 2 and 6 h or 50 ng/ml IFN-β. Total RNA was harvested, converted to cDNA, and probed for the indicated genes via qRT-PCR using IFNGR1-specific primers. n = 3 independent experiments, ±SE. ns, not significant to 0 h control by Student’s t-test. (b) THP-1 differentiated macrophages were treated with IFN-γ at 50 ng/ml for the indicated times, harvested, and immunoblotted for IFNGR1, phosphorylated STAT1, and total STAT1. (c) A549 cells were treated with indicated concentrations of IFN-γ for 4 h. Cells were harvested and lysates immunoblotted for indicated proteins. (d) THP-1 differentiated macrophages were treated with IFN-γ at 50 ng/ml for the indicated times prior to incubation with membrane impermeable biotin. Whole cell lysates (WCL) and biotinylated plasma membrane proteins (biotinylated, [Bio]) were probed for IFNGR1 and CD172a as a membrane control. (e) THP-1 differentiated macrophages were treated with CHX alone or CHX + IFN-γ for indicated times. Cells were harvested and lysates immunoblotted for IFNGR1. IFNGR1 densitometry normalized to β-actin expression; n = 3 independent experiments, ±SE. ns, not significant vs. CHX only control by Student’s t-test.
Figure 3
Figure 3. Lysine ubiquitin acceptor sites impact IFNGR1 stability
(a) Primary sequence of the IFNGR1 cytoplasmic juxtamembrane region. Putative residues necessary for protein stability and ubiquitination are underlined. Trans, transmembrane domain. (be) HEK Cells were transfected with Wt or various IFNGR1 V5 lysine to arginine mutant plasmids to determine the role of putative ubiquitin acceptor sites on IFNGR1 degradation. At 24–48 h post-transfection, cells were treated with CHX for indicated times and immunoblotted for V5 to determine protein half-life. (c) IFNGR1 protein densitometry normalized to β-actin and CHX 0 h to determine protein half-life; At least n = 3 independent experiments per group, ±SE. *P < 0.05 vs. control by ANOVA and Tukey’s t-test. (e) IFNGR1 protein densitometry normalized to β-actin and CHX 0 h to determine protein half-life; At least n = 3 independent experiments per group, ±SE. #,#P < 0.05 vs. K277,279,285R by Student’s t-test. (f) HEK cells were transfected with V5-tagged IFNGR1. At 48 h post-transfection, cell lysates were boiled and immunoprecipitated using the TUBEs reagent (Lifesensors) to pull down total ubiquitinated proteins. Immunoprecipitated lysates were probed for exogenous IFNGR1 with a V5 antibody. Input was probed for V5 and actin as a loading control. UT, untransfected. n = 3 independent experiments per group.
Figure 4
Figure 4. Inhibition of GSK3β decreases IFNGR1 stability
(a) HEK and (b) THP-1 cells were treated with TWS119 (10 μM) for indicated times (left) or with TWS119 for 4 h at the indicated concentrations (right); n = 3 independent experiments. Right: THP-1 IFNGR1 protein densitometry normalized to β-actin and TWS-119 0 h to determine protein stability. *P < 0.05 vs. control by ANOVA and Tukey’s t-test. (c) HEK and (d) THP-1 cells were transfected with dicer substrate short interfering RNA (DsiRNA) against GSK3β (Dsi GSK2/GSK3) or a dicer control RNA (DsiCon) for 72 h and then treated with CHX for the indicated times prior to harvest. n = 3 independent experiments for each group. Right: THP-1 IFNGR1 protein densitometry normalized to β-actin and TWS-119 0 h to determine protein stability. *P < 0.05 vs. DsiCon by ANOVA. (e) HEK cells were transfected with a plasmid expressing GSK3β or an empty vector control for 48 h and then treated with CHX for the indicated times prior to harvest. GSK3β endo (endogenous), exo (exogenous). Con, control plasmid. n = 3 independent experiments. (f) THP-1 cells were treated with TWS119 (10 μM) for indicated times (left) or with TWS119 for 4 h at the indicated concentrations (right). Cells were then treated with IFN-γ 15 min prior to harvesting and immunoblotted for IFNGR1 protein and phosphorylated STAT1 (pSTAT1) to measure IFN-γ activity. n = 3 independent experiments.
Figure 5
Figure 5. Consensus phosphorylation sites modulate IFNGR1 stability
(a) Primary sequence of the IFNGR1 cytoplasmic juxtamembrane region. Serine and threonine residues mutated to either alanine and aspartic acid in the quadruple mutant are in bold. The sites of ubiquitination described in Figure 3 are indicated in small font and underlined. (b) HEK cells were transfected with various IFNGR1 V5-tagged serine or threonine point mutants. At 24 h post-transfection, cells were treated with CHX for indicated times and immunoblotted to determine protein half-life. Top right: Wt IFNGR1 and quadruple mutant serine/threonine mutant (S/T-A, S/T-D) densitometry normalized to β actin expression; n = 3 independent experiments per group, ±SE. *P < 0.05 S/T-D vs. Wt by ANOVA and Tukey’s t-test. Bottom right: IFNGR1 remaining at 4 h post-CHX treatment normalized to 0 h. n = 3 independent experiments per group, ±SE. *P < 0.05 mutant vs. Wt by ANOVA and Tukey’s t-test, #P < 0.05 aspartate vs. alanine mutant by Student’s t-test. (c) HEK cells were transfected with plasmids encoding V5-tagged IFNGR1 Wt, and the S/T-A, S/T-D mutants for 48 h followed by treatment with MG132 for 2 h to stabilize ubiquitinated proteins prior to harvest. Cells were then harvested, boiled, and subjected to IP for V5, and probed for ubiquitin. n = 2 independent experiments. (d) HEK cells were transfected with plasmids encoding V5-tagged IFNGR1 Wt, K-R (277, 279, 285R) or the S/T-A quadruple mutants for 48 h followed by treatment with DMSO or TWS-119 (10 μM) for 2 or 4 h. Cells were then harvested and probed for IFNGR1 expression. Right: percent decrease in IFNGR1 expression after 4 h treatment with TWS119. n = 3 independent experiments ± SE. *P < 0.05 mutant vs. Wt by ANOVA and Tukey’s t-test.
Figure 6
Figure 6. Localization of IFNGR1 mutant proteins
(a) HEK cells were transfected with plasmids encoding V5-tagged IFNGR1 Wt, K-R, or the S/T-A, S/T-D mutants for 48 h. Cells were then treated with membrane impermeable biotin, harvested, and probed for IFNGR1 to determine plasma membrane localization. Wt (No Bio) = transfected, no biotin control, UT, untransfected. n = 2 independent experiments. (b) A549 cells were transfected with plasmids encoding V5-tagged IFNGR1 Wt, K-R, or the S/T-A, S/T-D mutants on coverslips for 48 h. Cells were then fixed, permeabilized and stained for DAPI for nuclear staining, phalloidin to visualize the plasma membrane, and V5 to examine IFNGR. Scale bar = 25 μm.
Figure 7
Figure 7. Ubiquitination is necessary for efficient IFNGR1 signaling
(a) Several HEK cell lines with IFNGR1 knocked out by CRISPR–Cas9 (HEK Cas9) were transfected with IFNGR1 to rescue IFNGR1 signaling. Cells were transfected with empty vector or IFNGR1 for 48 h and treated with 50 ng/ml IFN-γ 15 min prior to harvest. Cells were then harvested and probed for IFNGR1, and pSTAT1. HEK Cas9 IFNGR1 KO cell line 1#1 was used in subsequent experiments and cells were treated as described above. (b) HEK Cas9 cells were transfected with various IFNGR1 lysine to arginine mutant plasmids and probed for IFNGR1 levels and phosphorylated STAT1 (pSTAT1). (c) HEK cells were transfected with indicated amounts of Wt IFNGR1 or the K-R (277, 279, 285R) mutant plasmids for 48 h, harvested and probed for IFNGR1 and pSTAT1 by immunoblotting. (d) Densitometry of pSTAT1 in HEK transfected with 0.02, 0.1, 0.20, 0.5 μg/ml of Wt or K-R mutant IFNGR1. *P < 0.05 Wt vs. K-R by Student’s t-test. Below: pSTAT1 signaling normalized to total protein expression at 0.10, 0.20, 0.50 μg/ml DNA transfection. *P < 0.05 Wt vs. K-R by Student’s t-test. (e) HEK cells were transfected with 0.5 μg/ml plasmids encoding V5-tagged IFNGR1 Wt or K-R, for 48 h. Cells were then treated with membrane impermeable biotin, harvested, and probed for IFNGR1 to determine plasma membrane localization. Wt (No Bio) = transfected, no biotin control, UT, untransfected. Below: pSTAT1 normalized to plasma membrane IFNGR1 expression in cells transfected with Wt or K-R mutant IFNGR1. (f) IFN-γ stimulated gene induction in HEK cells. HEK cells and HEK IFNGR1 Cas9 KO cells were seeded into 6-well plates. HEK IFNGR1 Cas9 KO cells were transfected with empty vector, Wt IFNGR1 0.5 μg/ml, for 24–48 h. Cells were then treated with IFN-γ (50 ng/ml) for indicated times, harvested for RNA and cDNA, and probed for IFN-γ stimulated gene induction by qRT-PCR. (g) HEK IFNGR1 Cas9 KO cells were transfected with Wt IFNGR1 or K-R mutant as described above. n = 3–4 independent experiments ± SE. *P < 0.05 K-R vs. Wt by ANOVA.

Similar articles

Cited by

References

    1. Pollard KM, Cauvi DM, Toomey CB, Morris KV, Kono DH. Interferon-γ and systemic autoimmunity. Discov Med. 2013;16:123–131. - PMC - PubMed
    1. Haverkamp MH, van Dissel JT, Holland SM. Human host genetic factors in nontuberculous mycobacterial infection: lessons from single gene disorders affecting innate and adaptive immunity and lessons from molecular defects in interferon-γ-dependent signaling. Microbes Infect. 2006;8:1157–1166. doi: 10.1016/j.micinf.2005.10.029. - DOI - PubMed
    1. Schroder K, Hertzog PJ, Ravasi T, Hume DA. Interferon-γ: an overview of signals, mechanisms and functions. J Leukoc Biol. 2004;75:163–189. doi: 10.1189/jlb.0603252. - DOI - PubMed
    1. de Vor IC, van der Meulen PM, Bekker V, Verhard EM, Breuning MH, Harnisch E, et al. Deletion of the entire interferon-γ receptor 1 gene causing complete deficiency in three related patients. J Clin Immunol. 2016;36:195–203. doi: 10.1007/s10875-016-0244-y. - DOI - PMC - PubMed
    1. Shah KM, Stewart SE, Wei W, Woodman CB, O’Neil JD, Dawson CW, et al. The EBV-encoded latent membrane proteins, LMP2A and LMP2B, limit the actions of interferon by targeting interferon receptors for degradation. Oncogene. 2009;28:3903–3914. doi: 10.1038/onc.2009.249. - DOI - PMC - PubMed

MeSH terms