

Optimizing genomic medicine in epilepsy through a gene-customized approach to missense variant interpretation
- PMID: 28864458
- PMCID: PMC5630035
- DOI: 10.1101/gr.226589.117
Optimizing genomic medicine in epilepsy through a gene-customized approach to missense variant interpretation
Abstract
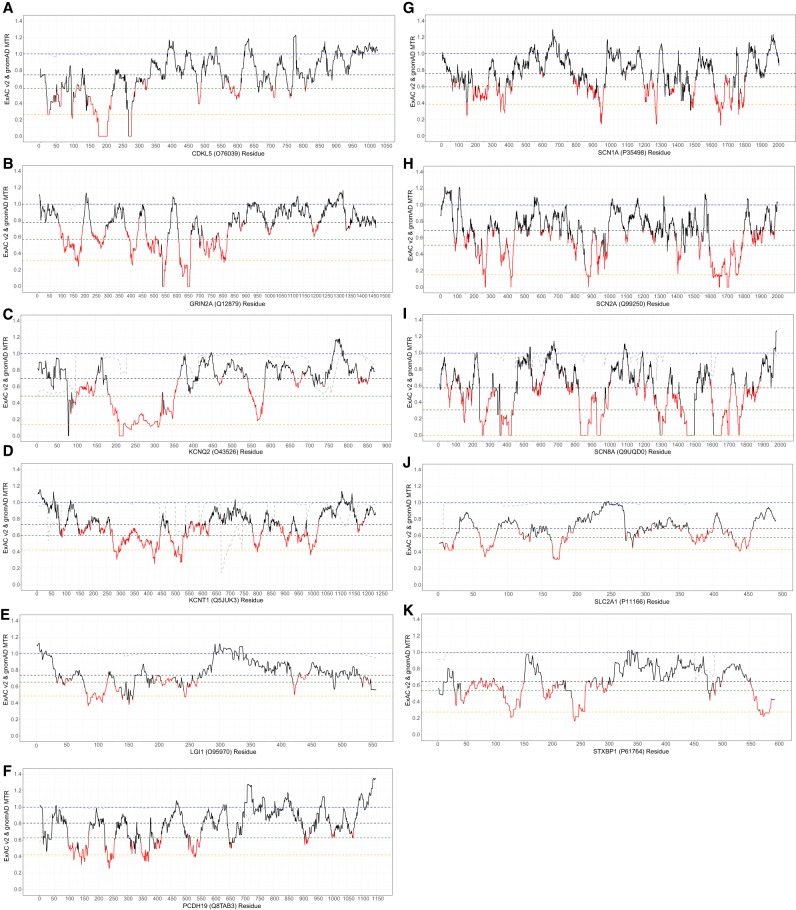
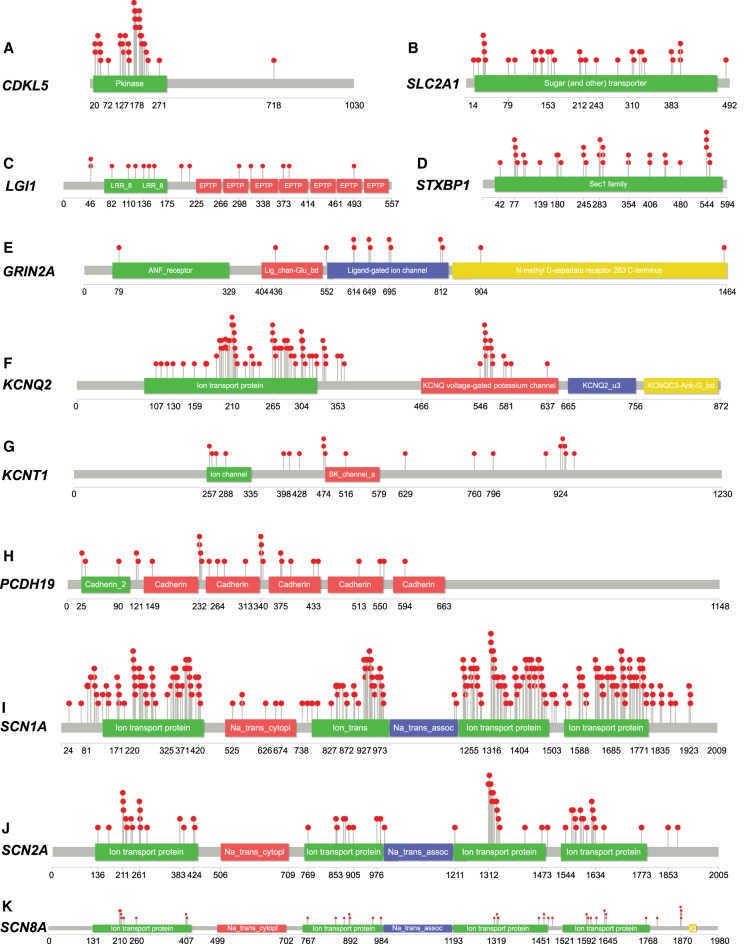
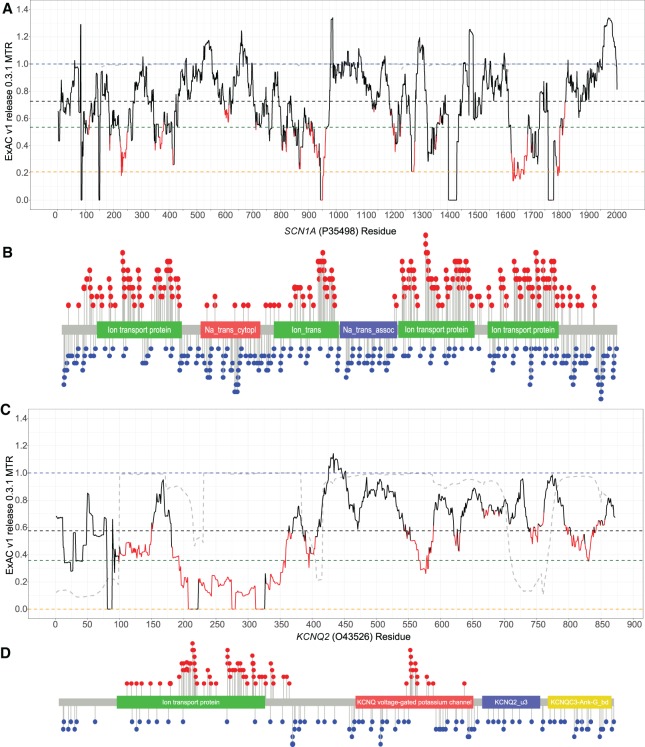
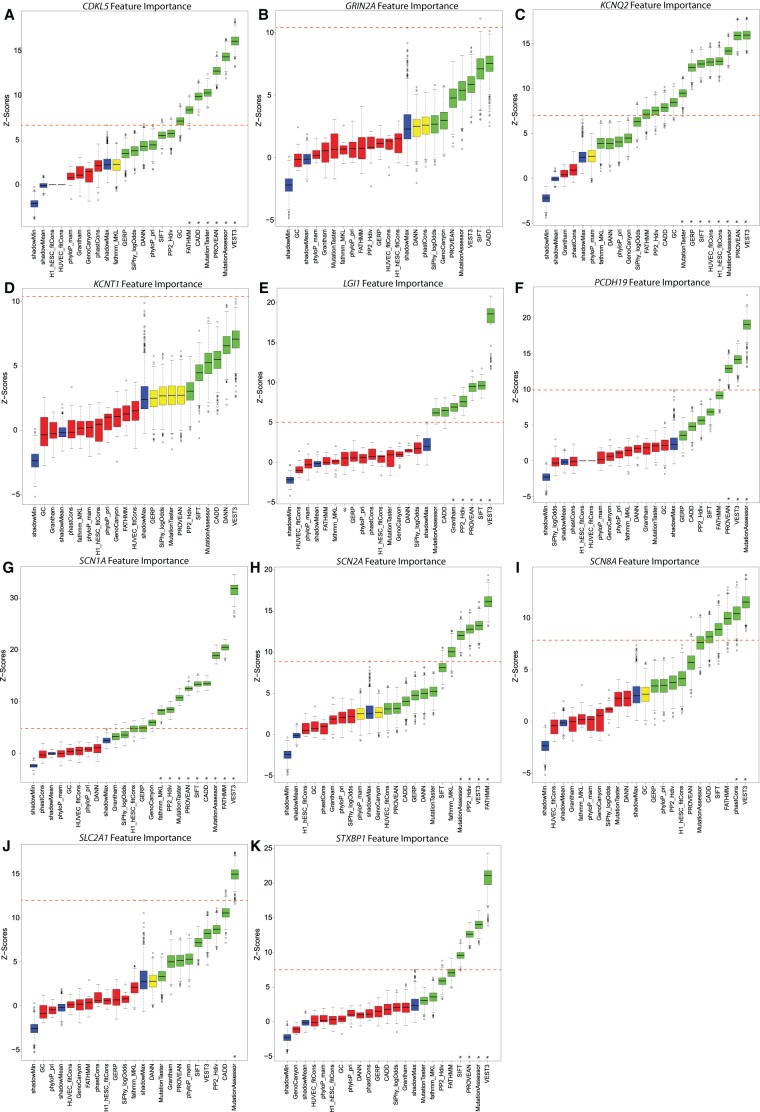
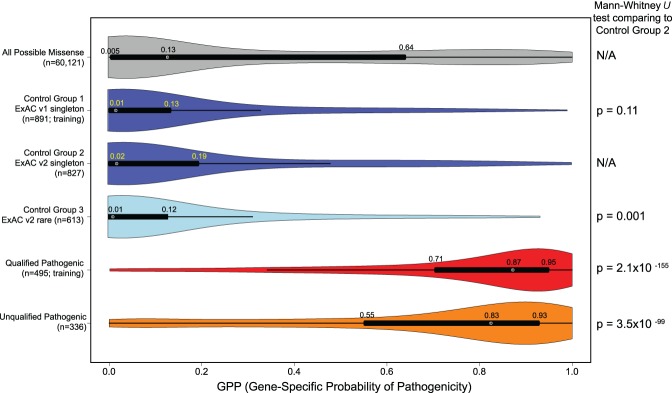
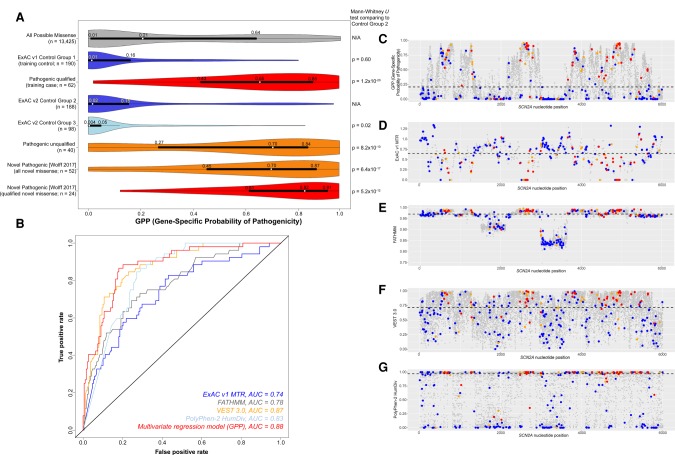
Gene panel and exome sequencing have revealed a high rate of molecular diagnoses among diseases where the genetic architecture has proven suitable for sequencing approaches, with a large number of distinct and highly penetrant causal variants identified among a growing list of disease genes. The challenge is, given the DNA sequence of a new patient, to distinguish disease-causing from benign variants. Large samples of human standing variation data highlight regional variation in the tolerance to missense variation within the protein-coding sequence of genes. This information is not well captured by existing bioinformatic tools, but is effective in improving variant interpretation. To address this limitation in existing tools, we introduce the missense tolerance ratio (MTR), which summarizes available human standing variation data within genes to encapsulate population level genetic variation. We find that patient-ascertained pathogenic variants preferentially cluster in low MTR regions (P < 0.005) of well-informed genes. By evaluating 20 publicly available predictive tools across genes linked to epilepsy, we also highlight the importance of understanding the empirical null distribution of existing prediction tools, as these vary across genes. Subsequently integrating the MTR with the empirically selected bioinformatic tools in a gene-specific approach demonstrates a clear improvement in the ability to predict pathogenic missense variants from background missense variation in disease genes. Among an independent test sample of case and control missense variants, case variants (0.83 median score) consistently achieve higher pathogenicity prediction probabilities than control variants (0.02 median score; Mann-Whitney U test, P < 1 × 10-16). We focus on the application to epilepsy genes; however, the framework is applicable to disease genes beyond epilepsy.
© 2017 Traynelis et al.; Published by Cold Spring Harbor Laboratory Press.
Figures
Similar articles
-
MTR-Viewer: identifying regions within genes under purifying selection.Nucleic Acids Res. 2019 Jul 2;47(W1):W121-W126. doi: 10.1093/nar/gkz457. Nucleic Acids Res. 2019. PMID: 31170280 Free PMC article.
-
Guideline-based and bioinformatic reassessment of lesion-associated gene and variant pathogenicity in focal human epilepsies.Epilepsia. 2018 Nov;59(11):2145-2152. doi: 10.1111/epi.14579. Epub 2018 Oct 20. Epilepsia. 2018. PMID: 30341947
-
Genetic variant pathogenicity prediction trained using disease-specific clinical sequencing data sets.Genome Res. 2019 Jul;29(7):1144-1151. doi: 10.1101/gr.240994.118. Epub 2019 Jun 24. Genome Res. 2019. PMID: 31235655 Free PMC article.
-
Opportunities, resources, and techniques for implementing genomics in clinical care.Lancet. 2019 Aug 10;394(10197):511-520. doi: 10.1016/S0140-6736(19)31140-7. Epub 2019 Aug 5. Lancet. 2019. PMID: 31395439 Free PMC article. Review.
-
Genomic medicine and risk prediction across the disease spectrum.Crit Rev Clin Lab Sci. 2015;52(3):120-37. doi: 10.3109/10408363.2014.997930. Epub 2015 Jan 19. Crit Rev Clin Lab Sci. 2015. PMID: 25597499 Review.
Cited by
-
Functional Assessment of Cancer-Linked Mutations in Sensitive Regions of Regulators of G Protein Signaling Predicted by Three-Dimensional Missense Tolerance Ratio Analysis.Mol Pharmacol. 2023 Jan;103(1):21-37. doi: 10.1124/molpharm.122.000614. Epub 2022 Nov 16. Mol Pharmacol. 2023. PMID: 36384958 Free PMC article.
-
Sub-genic intolerance, ClinVar, and the epilepsies: A whole-exome sequencing study of 29,165 individuals.Am J Hum Genet. 2021 Jun 3;108(6):965-982. doi: 10.1016/j.ajhg.2021.04.009. Epub 2021 Apr 30. Am J Hum Genet. 2021. PMID: 33932343 Free PMC article.
-
Autosomal Dominantly Inherited GREB1L Variants in Individuals with Profound Sensorineural Hearing Impairment.Genes (Basel). 2020 Jun 23;11(6):687. doi: 10.3390/genes11060687. Genes (Basel). 2020. PMID: 32585897 Free PMC article.
-
Distinguishing between PTEN clinical phenotypes through mutation analysis.Comput Struct Biotechnol J. 2021 May 21;19:3097-3109. doi: 10.1016/j.csbj.2021.05.028. eCollection 2021. Comput Struct Biotechnol J. 2021. PMID: 34141133 Free PMC article.
-
A Frameshift Variant of GluN2A Identified in an Epilepsy Patient Results in NMDA Receptor Mistargeting.J Neurosci. 2024 Jan 24;44(4):e0557232023. doi: 10.1523/JNEUROSCI.0557-23.2023. J Neurosci. 2024. PMID: 38050135 Free PMC article.
References
-
- Amendola LM, Jarvik GP, Leo MC, McLaughlin HM, Akkari Y, Amaral MD, Berg JS, Biswas S, Bowling KM, Conlin LK, et al. 2016. Performance of ACMG-AMP variant-interpretation guidelines among nine laboratories in the clinical sequencing exploratory research consortium. Am J Hum Genet 99: 247. - PMC - PubMed
-
- Amr SS, Al Turki SH, Lebo M, Sarmady M, Rehm HL, Abou Tayoun AN. 2017. Using large sequencing data sets to refine intragenic disease regions and prioritize clinical variant interpretation. Genet Med 19: 496–504. - PubMed
-
- Benjamini Y, Hochberg Y. 1995. Controlling the false discovery rate: a practical and powerful approach to multiple testing. J R Statist Soc Ser B (Methodol) 57: 289–300.
Publication types
MeSH terms
LinkOut - more resources
Full Text Sources
Other Literature Sources
Medical