

Sirtuin 3 Deficiency Accelerates Hypertensive Cardiac Remodeling by Impairing Angiogenesis
- PMID: 28862956
- PMCID: PMC5586452
- DOI: 10.1161/JAHA.117.006114
Sirtuin 3 Deficiency Accelerates Hypertensive Cardiac Remodeling by Impairing Angiogenesis
Abstract
Background: Emerging evidence indicates that impaired angiogenesis may contribute to hypertension-induced cardiac remodeling. The nicotinamide adenine dinucleotide-dependent deacetylase Sirtuin 3 (SIRT3) has the potential to modulate angiogenesis, but this has not been confirmed. As such, the aim of this study was to examine the relationship between SIRT3-mediated angiogenesis and cardiac remodeling.
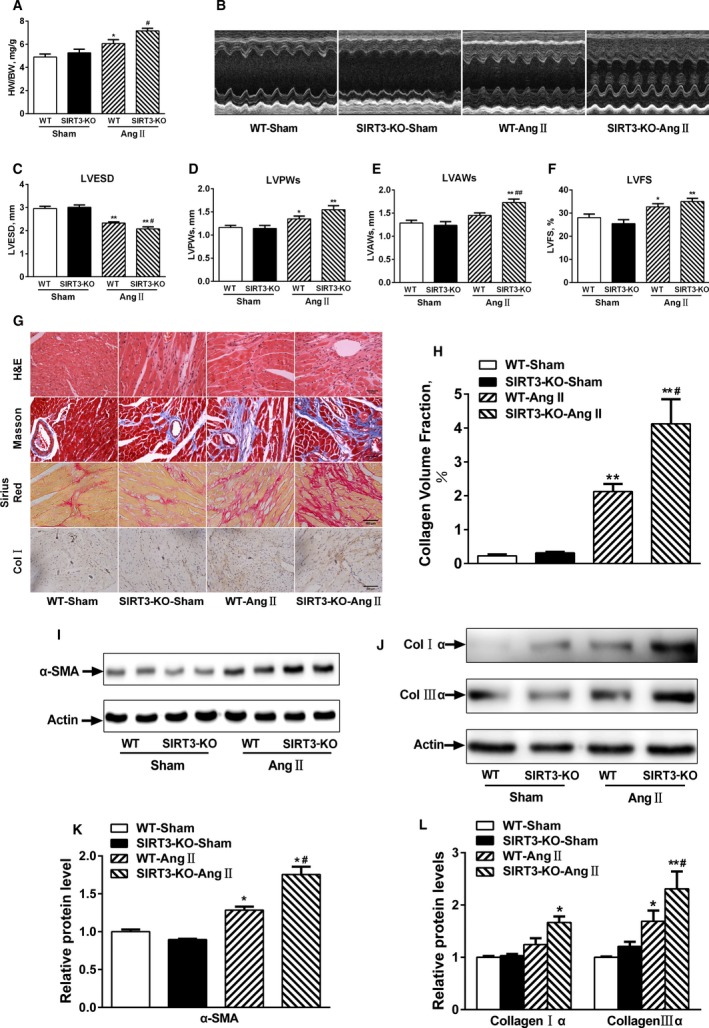
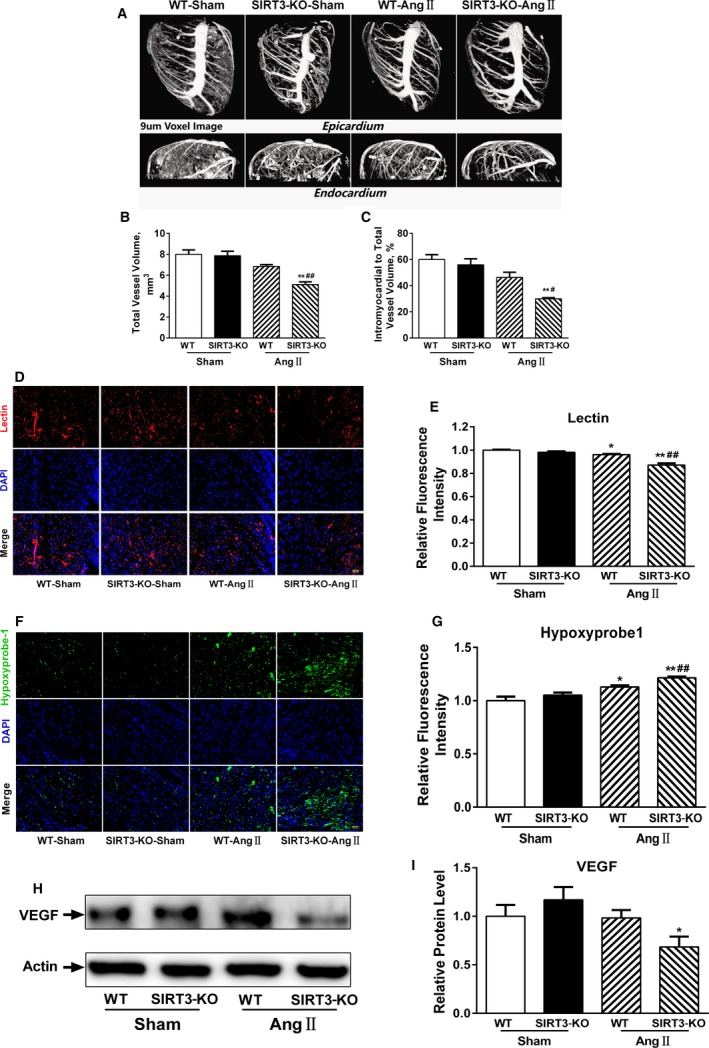
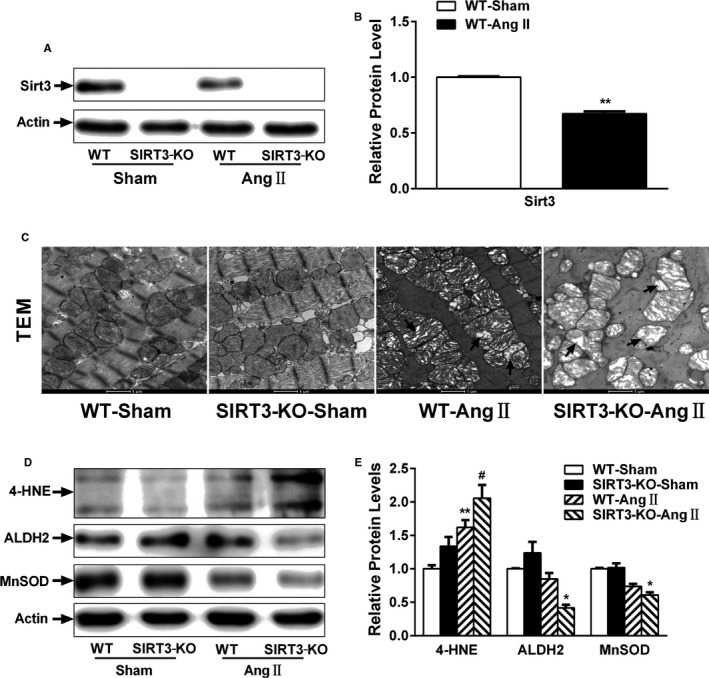
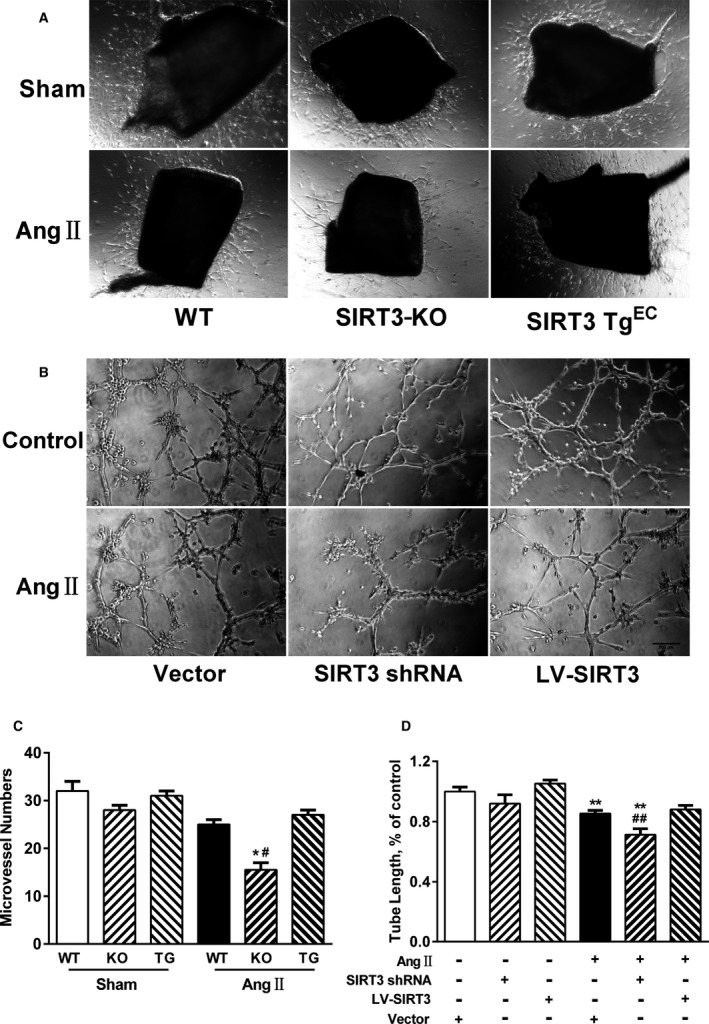
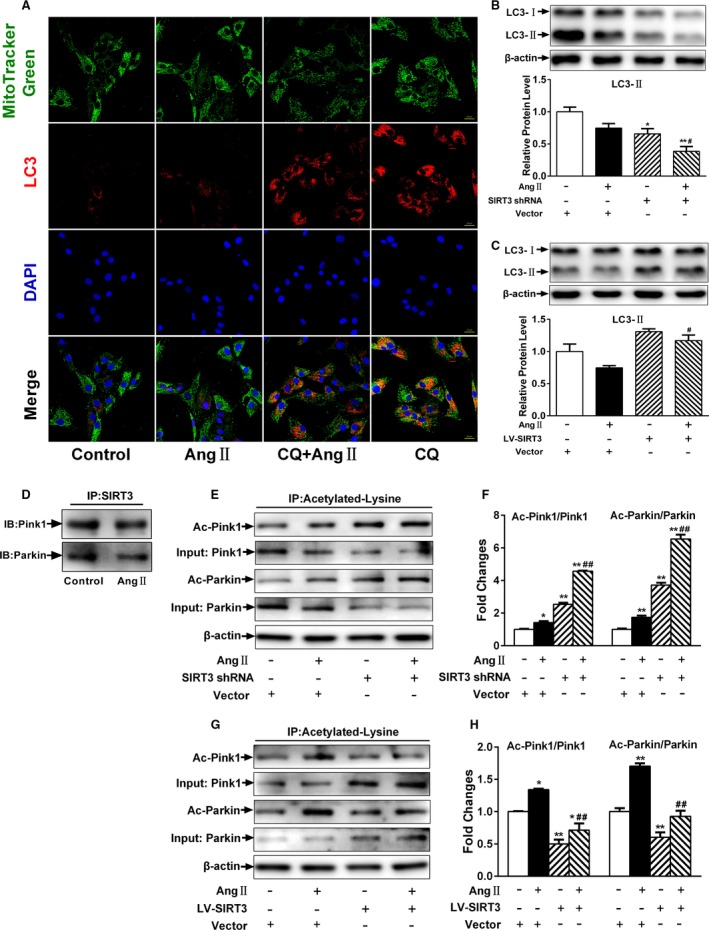
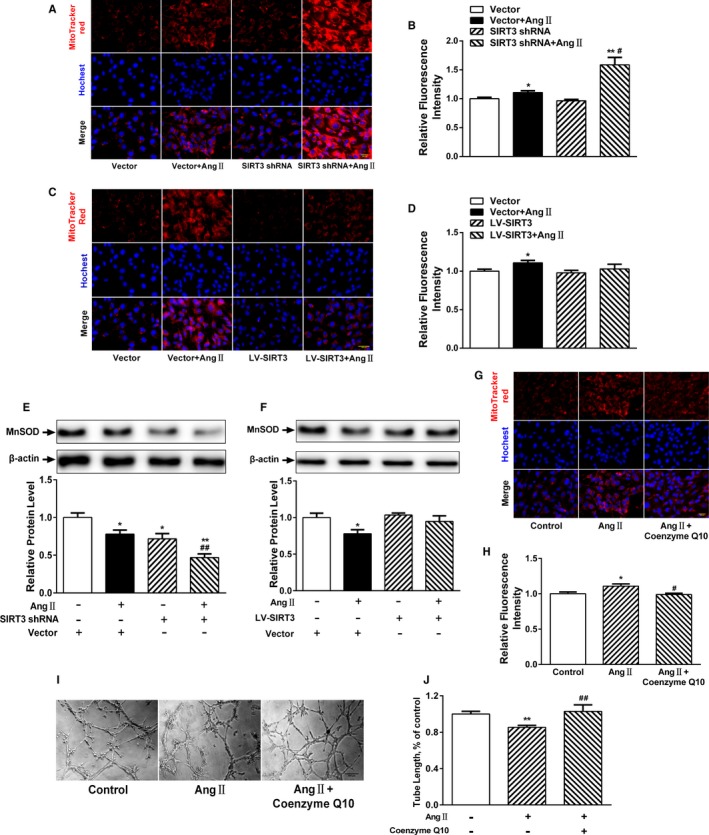
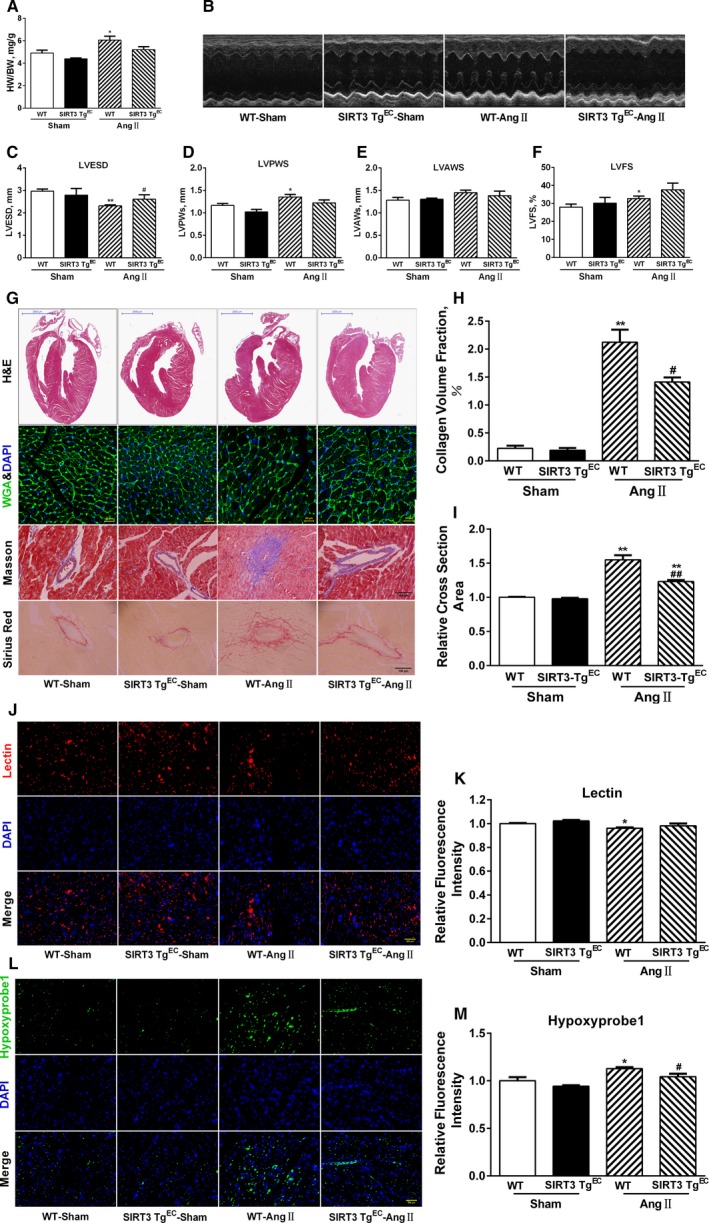
Methods and results: Our experiments were performed on SIRT3 knockout and age-matched wild-type mice infused with angiotensin II (1400 ng/kg per minute) or saline for 14 days. After angiotensin II infusion, SIRT3 knockout mice developed more severe microvascular rarefaction and functional hypoxia in cardiac tissues compared with wild-type mice. These events were concomitant with mitochondrial dysfunction and enhanced collagen I and collagen III expression, leading to cardiac fibrosis. Silencing SIRT3 facilitated angiotensin II-induced aberrant Pink/Parkin acetylation and impaired mitophagy, while excessive mitochondrial reactive oxygen species generation limited angiogenic capacity in primary mouse cardiac microvascular endothelial cells. Moreover, SIRT3 overexpression in cardiac microvascular endothelial cells enhanced Pink/Parkin-mediated mitophagy, attenuated mitochondrial reactive oxygen species generation, and restored vessel sprouting and tube formation. In parallel, endothelial cell-specific SIRT3 transgenic mice showed decreased fibrosis, as well as improved cardiac function and microvascular network, compared with wild-type mice with similar stimuli.
Conclusions: Collectively, these findings suggest that SIRT3 could promote angiogenesis through attenuating mitochondrial dysfunction caused by defective mitophagy.
Keywords: Sirtuin 3; angiogenesis; cardiac remodeling; mitochondria; mitophagy; oxidative stress.
© 2017 The Authors. Published on behalf of the American Heart Association, Inc., by Wiley.
Figures
Similar articles
-
Sirt3 deficiency exacerbates diabetic cardiac dysfunction: Role of Foxo3A-Parkin-mediated mitophagy.Biochim Biophys Acta Mol Basis Dis. 2017 Aug;1863(8):1973-1983. doi: 10.1016/j.bbadis.2016.10.021. Epub 2016 Oct 26. Biochim Biophys Acta Mol Basis Dis. 2017. PMID: 27794418 Review.
-
MicroRNA-195 Regulates Metabolism in Failing Myocardium Via Alterations in Sirtuin 3 Expression and Mitochondrial Protein Acetylation.Circulation. 2018 May 8;137(19):2052-2067. doi: 10.1161/CIRCULATIONAHA.117.030486. Epub 2018 Jan 12. Circulation. 2018. PMID: 29330215 Free PMC article.
-
SIRT3 deficiency exacerbates p53/Parkin‑mediated mitophagy inhibition and promotes mitochondrial dysfunction: Implication for aged hearts.Int J Mol Med. 2018 Jun;41(6):3517-3526. doi: 10.3892/ijmm.2018.3555. Epub 2018 Mar 9. Int J Mol Med. 2018. PMID: 29532856
-
Sirt3 protects mitochondrial DNA damage and blocks the development of doxorubicin-induced cardiomyopathy in mice.Am J Physiol Heart Circ Physiol. 2016 Apr 15;310(8):H962-72. doi: 10.1152/ajpheart.00832.2015. Epub 2016 Feb 12. Am J Physiol Heart Circ Physiol. 2016. PMID: 26873966 Free PMC article.
-
Mitochondrial SIRT3 and heart disease.Cardiovasc Res. 2010 Nov 1;88(2):250-6. doi: 10.1093/cvr/cvq250. Epub 2010 Aug 4. Cardiovasc Res. 2010. PMID: 20685942 Free PMC article. Review.
Cited by
-
Therapeutic effect of Sirtuin 3 on ameliorating nonalcoholic fatty liver disease: The role of the ERK-CREB pathway and Bnip3-mediated mitophagy.Redox Biol. 2018 Sep;18:229-243. doi: 10.1016/j.redox.2018.07.011. Epub 2018 Jul 20. Redox Biol. 2018. PMID: 30056271 Free PMC article.
-
Melatonin attenuates sepsis-induced acute kidney injury by promoting mitophagy through SIRT3-mediated TFAM deacetylation.Autophagy. 2024 Jan;20(1):151-165. doi: 10.1080/15548627.2023.2252265. Epub 2023 Aug 31. Autophagy. 2024. PMID: 37651673 Free PMC article.
-
Pathophysiological mechanisms underlying the beneficial effects of physical activity in hypertension.J Clin Hypertens (Greenwich). 2020 Feb;22(2):291-295. doi: 10.1111/jch.13804. Epub 2020 Jan 19. J Clin Hypertens (Greenwich). 2020. PMID: 31955526 Free PMC article. No abstract available.
-
Sirtuin-3-Mediated Cellular Metabolism Links Cardiovascular Remodeling with Hypertension.Biology (Basel). 2023 May 6;12(5):686. doi: 10.3390/biology12050686. Biology (Basel). 2023. PMID: 37237500 Free PMC article. Review.
-
Shaping cardiac destiny: the role of post-translational modifications on endoplasmic reticulum - mitochondria crosstalk in cardiac remodeling.Front Pharmacol. 2024 Oct 11;15:1423356. doi: 10.3389/fphar.2024.1423356. eCollection 2024. Front Pharmacol. 2024. PMID: 39464632 Free PMC article. Review.
References
-
- Deschepper CF, Llamas B. Hypertensive cardiac remodeling in males and females: From the bench to the bedside. Hypertension. 2007;49:401–407. - PubMed
-
- Ishizu T, Seo Y, Kameda Y, Kawamura R, Kimura T, Shimojo N, Xu D, Murakoshi N, Aonuma K. Left ventricular strain and transmural distribution of structural remodeling in hypertensive heart disease. Hypertension. 2014;63:500–506. - PubMed
-
- Oka T, Akazawa H, Naito AT, Komuro I. Angiogenesis and cardiac hypertrophy: maintenance of cardiac function and causative roles in heart failure. Circ Res. 2014;114:565–571. - PubMed
-
- Humar R, Zimmerli L, Battegay E. Angiogenesis and hypertension: an update. J Hum Hypertens. 2009;23:773–782. - PubMed
MeSH terms
Substances
LinkOut - more resources
Full Text Sources
Other Literature Sources
Medical
Molecular Biology Databases
Research Materials
