

Immune activated monocyte exosomes alter microRNAs in brain endothelial cells and initiate an inflammatory response through the TLR4/MyD88 pathway
- PMID: 28855621
- PMCID: PMC5577170
- DOI: 10.1038/s41598-017-10449-0
Immune activated monocyte exosomes alter microRNAs in brain endothelial cells and initiate an inflammatory response through the TLR4/MyD88 pathway
Abstract
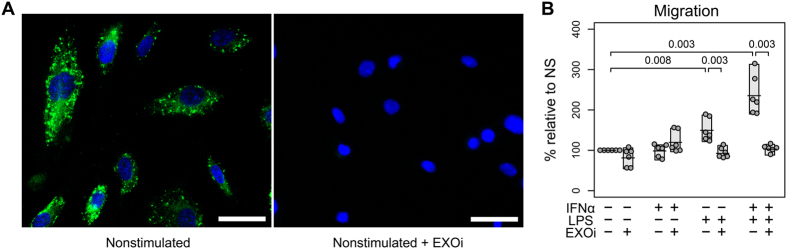
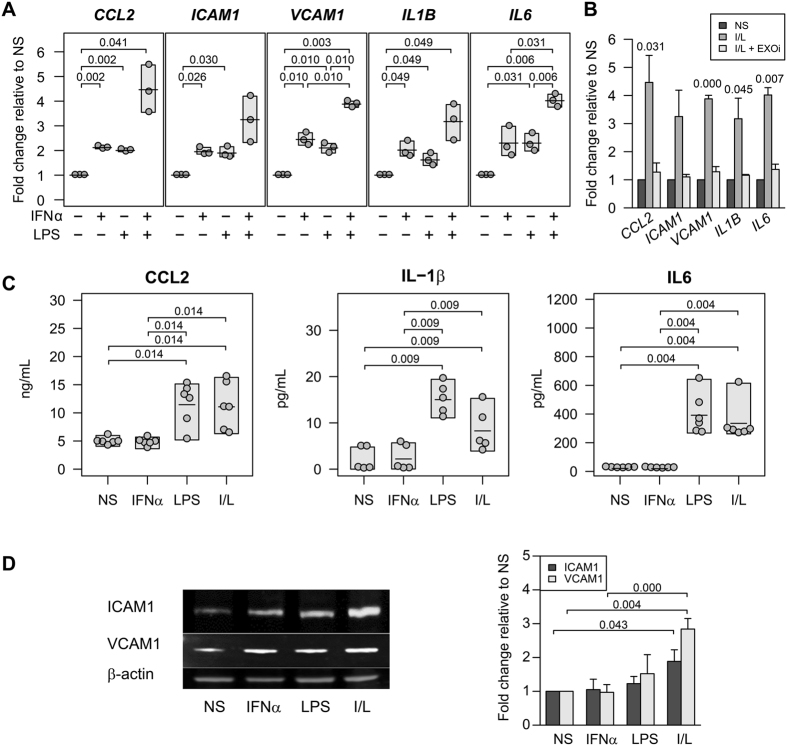
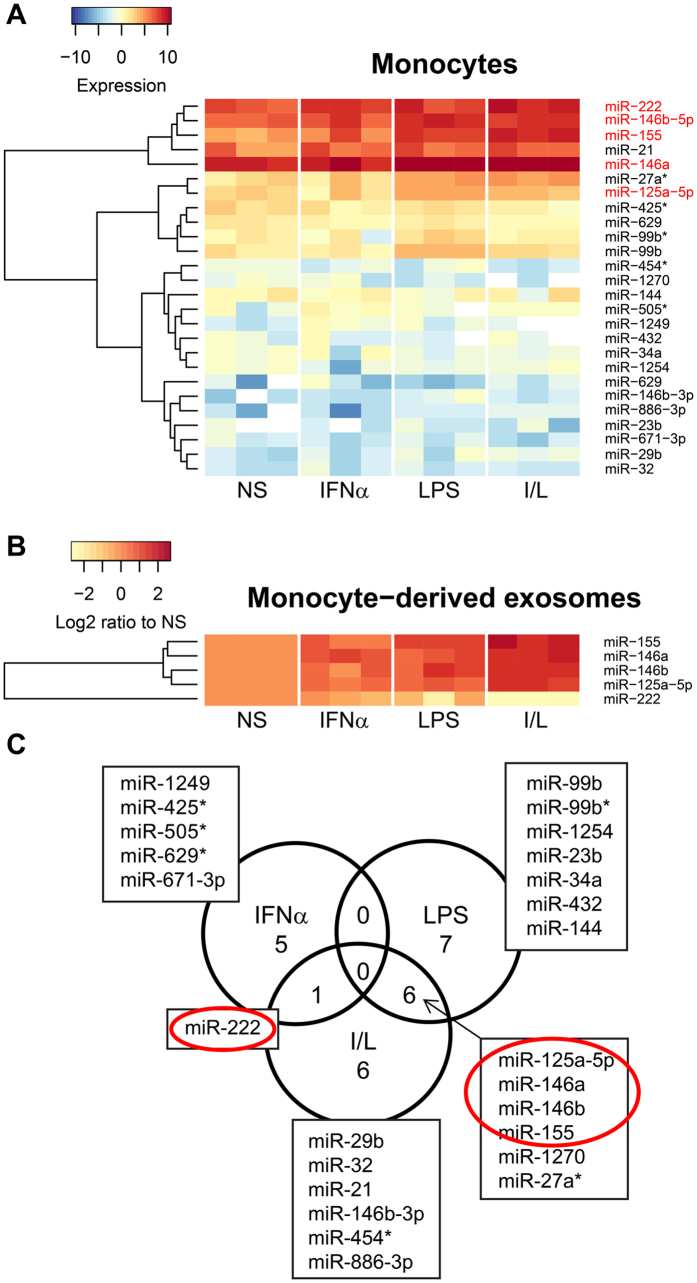
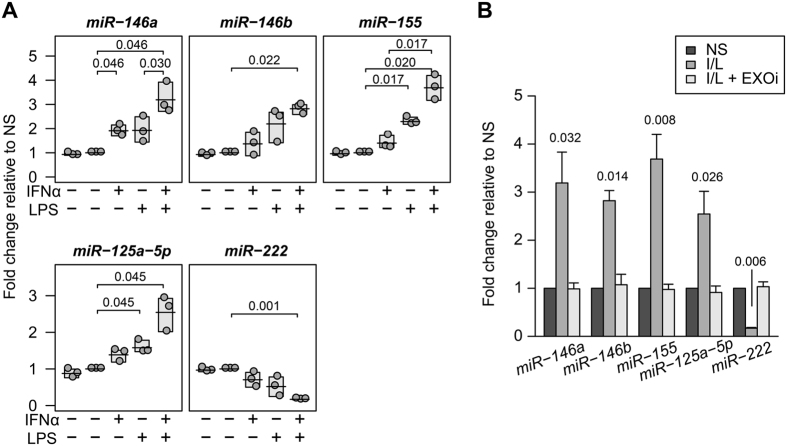
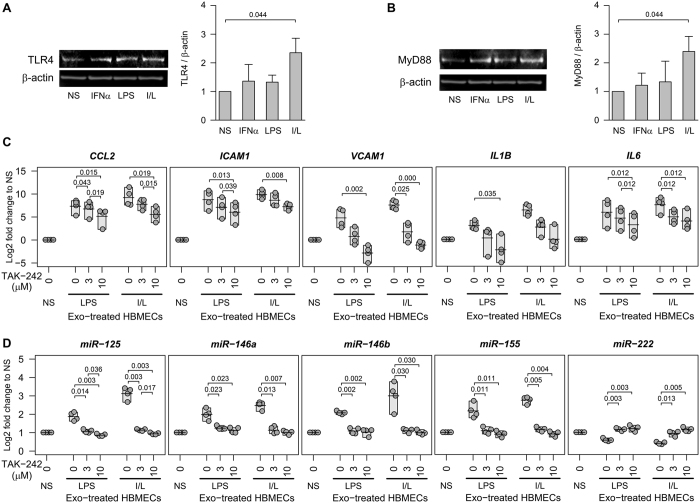
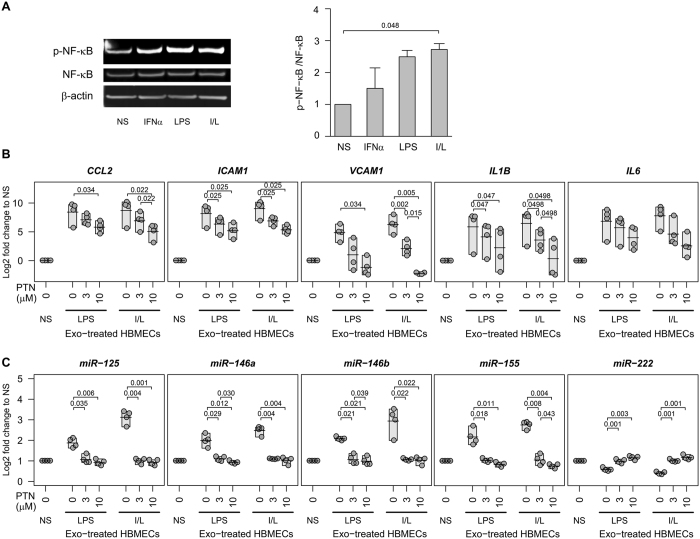
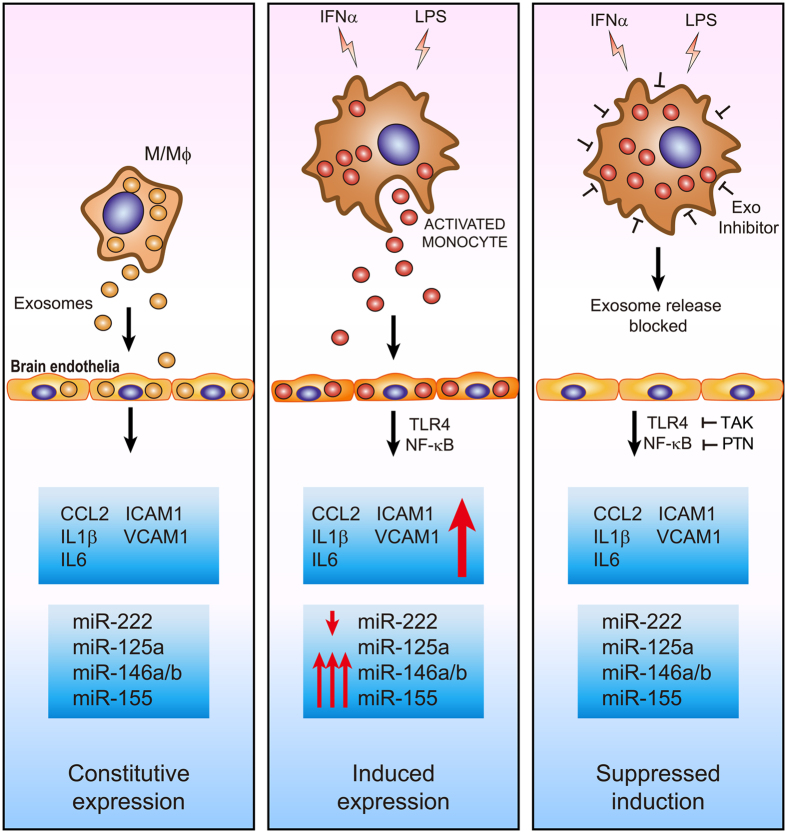
The host immune response is critical for homeostasis; however, when chronic low level activation of the immune response with or without the driver continues, a cascade of events can trigger immunological dysfunction. Monocytes are key peripheral sensors of the immune response and their activation is instrumental in the development of cognitive impairment. Here, we show that monocytes activated by interferon alpha, lipopolysaccharide or a combination of both generate exosomes carrying significantly altered microRNA profiles compared to non-activated monocytes. These exosomes alone can activate human brain microvascular endothelial cells to stimulate adhesion molecules, CCL2, ICAM1, VCAM1 and cytokines, IL1β and IL6. This activation is through the toll like receptor 4 (TLR4)/myeloid differentiation primary response gene 88 (MyD88) pathway that activates nuclear factor-κB and increases monocyte chemotaxis. Inhibition of monocyte exosome release reverses endothelial cell activation and monocyte chemotaxis. Our study suggests that activated monocytes have an impact on brain vascular function through intercellular exosome signaling.
Conflict of interest statement
The authors declare that they have no competing interests.
Figures
Similar articles
-
Monocyte exosomes induce adhesion molecules and cytokines via activation of NF-κB in endothelial cells.FASEB J. 2016 Sep;30(9):3097-106. doi: 10.1096/fj.201600368RR. Epub 2016 May 25. FASEB J. 2016. PMID: 27226520 Free PMC article.
-
Lipopolysaccharide induced LOX-1 expression via TLR4/MyD88/ROS activated p38MAPK-NF-κB pathway.Vascul Pharmacol. 2014 Dec;63(3):162-72. doi: 10.1016/j.vph.2014.06.008. Epub 2014 Aug 16. Vascul Pharmacol. 2014. PMID: 25135647
-
Dual regulation of osteopontin production by TLR stimulation in dendritic cells.J Leukoc Biol. 2013 Jul;94(1):147-58. doi: 10.1189/jlb.0412194. Epub 2013 Apr 22. J Leukoc Biol. 2013. PMID: 23610145
-
HIV-1 Tat Protein Activates both the MyD88 and TRIF Pathways To Induce Tumor Necrosis Factor Alpha and Interleukin-10 in Human Monocytes.J Virol. 2016 Jun 10;90(13):5886-5898. doi: 10.1128/JVI.00262-16. Print 2016 Jul 1. J Virol. 2016. PMID: 27053552 Free PMC article.
-
Subendothelial resistin enhances monocyte transmigration in a co-culture of human endothelial and smooth muscle cells by mechanisms involving fractalkine, MCP-1 and activation of TLR4 and Gi/o proteins signaling.Int J Biochem Cell Biol. 2014 May;50:29-37. doi: 10.1016/j.biocel.2014.01.022. Epub 2014 Feb 6. Int J Biochem Cell Biol. 2014. PMID: 24508784 Review.
Cited by
-
Effect of miR-506-3p on Proliferation and Apoptosis of Airway Smooth Muscle Cells in Asthmatic Mice by Regulating CCL2 Gene Expression and Mediating TLR4/NF-κB Signaling Pathway Activation.Mol Biotechnol. 2021 May;63(5):410-423. doi: 10.1007/s12033-021-00309-8. Epub 2021 Feb 27. Mol Biotechnol. 2021. PMID: 33638773
-
Extracellular vesicles: new players in regulating vascular barrier function.Am J Physiol Heart Circ Physiol. 2020 Dec 1;319(6):H1181-H1196. doi: 10.1152/ajpheart.00579.2020. Epub 2020 Oct 9. Am J Physiol Heart Circ Physiol. 2020. PMID: 33035434 Free PMC article.
-
Emerging role of extracellular vesicles in multiple sclerosis: From cellular surrogates to pathogenic mediators and beyond.J Neuroimmunol. 2023 Apr 15;377:578064. doi: 10.1016/j.jneuroim.2023.578064. Epub 2023 Mar 11. J Neuroimmunol. 2023. PMID: 36934525 Free PMC article. Review.
-
The Guizhi Gancao Decoction Attenuates Myocardial Ischemia-Reperfusion Injury by Suppressing Inflammation and Cardiomyocyte Apoptosis.Evid Based Complement Alternat Med. 2019 Jan 21;2019:1947465. doi: 10.1155/2019/1947465. eCollection 2019. Evid Based Complement Alternat Med. 2019. PMID: 30800167 Free PMC article.
-
Exosomes, the message transporters in vascular calcification.J Cell Mol Med. 2018 Sep;22(9):4024-4033. doi: 10.1111/jcmm.13692. Epub 2018 Jun 12. J Cell Mol Med. 2018. PMID: 29892998 Free PMC article. Review.
References
-
- Thery C, Zitvogel L, Amigorena S. Exosomes: composition, biogenesis and function. Nature reviews. Immunology. 2002;2:569–579. - PubMed
-
- Tang N, Sun B, Gupta A, Rempel H, Pulliam L. Monocyte exosomes induce adhesion molecules and cytokines via activation of NF-kappaB in endothelial cells. FASEB journal: official publication of the Federation of American Societies for Experimental Biology. 2016;30:3097–3106. doi: 10.1096/fj.201600368RR. - DOI - PMC - PubMed
MeSH terms
Substances
LinkOut - more resources
Full Text Sources
Other Literature Sources
Miscellaneous
