. 2017 Oct 1;199(7):2356-2365.
doi: 10.4049/jimmunol.1602102. Epub 2017 Aug 25.

A20 Restrains Thymic Regulatory T Cell Development

Affiliations

A20 Restrains Thymic Regulatory T Cell Development

Julius Clemens Fischer et al. J Immunol. .

Abstract

Maintaining immune tolerance requires the production of Foxp3-expressing regulatory T (Treg) cells in the thymus. Activation of NF-κB transcription factors is critically required for Treg cell development, partly via initiating Foxp3 expression. NF-κB activation is controlled by a negative feedback regulation through the ubiquitin editing enzyme A20, which reduces proinflammatory signaling in myeloid cells and B cells. In naive CD4+ T cells, A20 prevents kinase RIPK3-dependent necroptosis. Using mice deficient for A20 in T lineage cells, we show that thymic and peripheral Treg cell compartments are quantitatively enlarged because of a cell-intrinsic developmental advantage of A20-deficient thymic Treg differentiation. A20-deficient thymic Treg cells exhibit reduced dependence on IL-2 but unchanged rates of proliferation and apoptosis. Activation of the NF-κB transcription factor RelA was enhanced, whereas nuclear translocation of c-Rel was decreased in A20-deficient thymic Treg cells. Furthermore, we found that the increase in Treg cells in T cell-specific A20-deficient mice was already observed in CD4+ single-positive CD25+ GITR+ Foxp3- thymic Treg cell progenitors. Treg cell precursors expressed high levels of the tumor necrosis factor receptor superfamily molecule GITR, whose stimulation is closely linked to thymic Treg cell development. A20-deficient Treg cells efficiently suppressed effector T cell-mediated graft-versus-host disease after allogeneic hematopoietic stem cell transplantation, suggesting normal suppressive function. Holding thymic production of natural Treg cells in check, A20 thus integrates Treg cell activity and increased effector T cell survival into an efficient CD4+ T cell response.


Figures

Figure 1
Figure 1
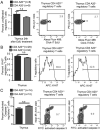
Increased numbers of Treg cells in mice lacking A20 specifically in T cells. (A) Thymocytes of adult A20F/F CD4Cre− (CD4 A20+/+) and A20F/F CD4Cre+ (CD4 A20−/−) mice were stained with anti-CD4, anti-CD8, anti-Foxp3, and live/dead reagent. The population of Foxp3+ Treg cells of live CD4+ CD8 cells was determined by flow cytometry (left panel), and total Treg cell number was calculated (right panel). Pooled data of five independent experiments are shown. Animal numbers per group (n) are depicted. (B) Gating strategy and representative FACS plots of the experiments depicted in (A). (C) Splenocytes of adult CD4 A20+/+ and CD4 A20−/− mice were stained as in (A). The population of Foxp3+ Treg cells of live CD4+ cells was determined by flow cytometry (left panel), and total Treg cell number was calculated (right panel). Pooled data of five independent experiments are shown. Animal numbers per group (n) are depicted. (D) Gating strategy and representative FACS plots of the experiments depicted in (C). (E) Lymph node cells of adult CD4 A20+/+ and CD4 A20−/− mice were stained as in (A). The Foxp3+ Treg cell fraction of all live CD4+ cells was determined by flow cytometry. Pooled data of three independent experiments are shown. Animal numbers per group (n) are depicted. (F) Splenocytes of 12- and 50-d–old CD4 A20+/+ and CD4 A20−/− mice were analyzed for CD4 and Foxp3 expression by flow cytometry. Treg cell fractions of live CD4 cells and absolute Treg cell numbers are shown. Pooled data of three independent experiments are shown. Animal numbers per group (n) are depicted. Data were analyzed using ordinary one-way ANOVA for multiple comparisons or one- and two-tailed unpaired t test. Data are presented as mean ± SEM. Significance was set at *p < 0.05, **p < 0.01, ***p < 0.001.
Figure 2
Figure 2
A20-deficient T cells show reduced Treg cell expansion and differentiation in vitro. (A) A total of 50 × 103 FACS-sorted A20+/+ and A20−/− CD4+ CD25+ Treg cells was cultured in vitro in the presence of plate-bound anti-CD3 and soluble anti-CD28 with or without IL-2 for 4 d, and absolute numbers of live cells were determined. One representative of three independent experiments is shown. (B) A total of 40 × 103 CD4+ CD62Lhigh CD44low A20+/+ and A20−/− T cells was cultured in vitro in the presence of plate-bound anti-CD3 and soluble anti-CD28, ± IL-2 and ± TGF-β for 4 d. Conversion toward a Treg cell phenotype was determined by intracellular Foxp3 staining, and absolute numbers of live cells were determined. One representative of three independent experiments is shown. Data were analyzed using ordinary one-way ANOVA for multiple comparisons and two-tailed unpaired t test. Data are presented as mean ± SEM. Significance was set at *p < 0.05, **p < 0.01, ***p < 0.001.
Figure 3
Figure 3
A20 deficiency in T cells drives thymic Treg cell development cell-intrinsically. (A) CD45.1+ CD45.2+ double-positive C57BL/6 recipient mice received 11 Gy TBI and were then transplanted with 2.5 × 10⁶ T cell–depleted C57BL/6 WT BM expressing only CD45.1. In addition, recipient mice received either 2.5 × 10⁶ CD4 A20+/+ or 2.5 × 10⁶ CD4 A20−/− T cell–depleted C57BL/6 BM, both expressing only CD45.2. (B) Three months after transplantation, numbers and frequencies of CD11c+ dendritic cells, B220+ B cells, CD4+ T cells, and CD4+ CD8 Foxp3+ Treg cells were determined in thymus and spleen of corresponding animals by FACS analysis. CD45.1 and CD45.2 expression of cell subsets were analyzed, and CD45.2+/CD45.1+ ratios were calculated. Residual recipient cells were identified (CD45.1+ CD45.2+ double-positives) and were excluded from the calculation. One representative of two independent experiments is shown. Animal numbers per group (n) are depicted. (C) Gating strategy and representative FACS plots of thymic Treg cells of the analysis depicted in (B). (D) Percentage of Foxp3+ Treg cells of CD4+ CD8 cells were determined in thymus and spleen of recipient mice that were transplanted as described in (A). One representative of two independent experiments is shown. Animal numbers per group (n) are depicted. Experiments were analyzed using two-tailed unpaired t test. Data are presented as mean ± SEM. Significance was set at *p < 0.05, **p < 0.01, ***p < 0.001.
Figure 4
Figure 4
A20 deficiency reduces the dependence of thymic T regulatory cells on IL-2. (A) CD4 A20+/+ or CD4 A20−/− mice were injected i.p. with anti–IL-2 neutralizing Ab and analyzed 6 d after first treatment. One group of each genotype was left without anti–IL-2 treatment as control. Thymocytes were stained with anti-CD4, anti-CD8, anti-Foxp3, and live/dead reagent, and the population of Foxp3+ Treg cells of live CD4+ CD8 cells was determined by flow cytometry. Shown are the gating strategy and representative FACS plots of thymic Treg cells. (B) Experiments and analyses as described in (A). (Left panel) Frequency of Foxp3+ Treg cells of CD4+ CD8 cells. (Right panel) Absolute number of Foxp3+ CD4+ CD8 Treg cells. Pooled data of three independent experiments are shown. Animal numbers per group (n) are depicted. Experiments were analyzed using two-tailed unpaired t test. Data are presented as mean ± SEM. Significance was set at **p < 0.01, and ***p < 0.001.
Figure 5
Figure 5
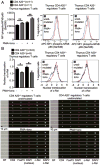
Thymic A20-deficient Treg cells show unchanged proliferation and apoptosis. (A) CD4 A20+/+ and CD4 A20−/− mice were treated with 50 mg/kg EdU. Twenty-four hours after application, harvested thymocytes were stained with live/dead reagent, anti-CD4, anti-CD8, and anti-Foxp3, and EdU Click-iT staining was performed. The population of EdU+ Treg cells of all Foxp3+ Treg cells was determined by flow cytometry. Pooled data of two independent experiments are shown (left panel). Animal numbers per group (n) are depicted. Gating strategy and representative FACS plots of the experiments are shown (right panels). (B) Thymocytes of adult CD4 A20+/+ and CD4 A20−/− mice were stained with live/dead reagent, anti-CD4, anti-CD8, anti-Foxp3, and anti–KI-67. The population of KI-67+ Treg cells of all Foxp3+ Treg cells was determined by flow cytometry. Pooled data of six independent experiments are shown (left panel). Animal numbers per group (n) are depicted. Gating strategy and representative histograms of the experiments are shown (right panels). (C) Thymocytes of adult CD4 A20+/+ and CD4 A20−/− mice were incubated with an active caspase-3 staining reagent for 45 min and stained with live/dead reagent, anti-CD4, anti-CD8, and anti-Foxp3. The population of activated caspase-3+ Treg cells of all Foxp3+ Treg cells was determined by flow cytometry. Pooled data of three independent experiments are shown (left panel). Animal numbers per group (n) are depicted. Gating strategy and representative FACS plots of the experiments are shown (right panels). Experiments were analyzed using two-tailed unpaired t test. Data are presented as mean ± SEM. Significance was set at p < 0.05.
Figure 6
Figure 6
Thymic A20-deficient Treg cells show enhanced RelA activation and reduced nuclear trans-location of c-Rel. (A) Thymocytes of adult CD4 A20+/+ and CD4 A20−/− mice were left unstimulated or stimulated with PMA and ionomycin (Iono) for 30 min and stained with live/dead reagent, anti-CD4, anti-CD8, anti-Foxp3, and anti–phospho-NF-κB p65. Median fluorescence intensity (MFI) of phospho–NF-κB of CD4+ CD8 (CD4SP) Foxp3+ Treg cells was determined by flow cytometry. Pooled data of two independent experiments are shown. Animal numbers per group (n) are depicted (left panel). Representative histograms showing fluorescence intensity of phospho–NF-κB p65 of Treg cells are shown (right panels). (B) CD8+ cell MACS-depleted thymocytes of CD4 A20+/+ and CD4 A20−/− mice were left unstimulated or stimulated with PMA and Iono for 30 min; stained with anti-CD4, anti-CD8, anti-Foxp3, anti–c-Rel, and DAPI; and acquired on an imaging flow cytometer. Nuclear translocation of CD4SP Foxp3+ Treg cells was quantified based on the similarity score of c-Rel and nuclear image intensities. Pooled data of two independent experiments are shown. Animal numbers per group (n) are depicted (left panel). Representative histograms show the nuclear translocation score of unstimulated and stimulated CD4SP Foxp3+ Treg cell populations (right panels). Exemplary images are representative for the mean nuclear translocation score of indicated populations (lower panels). Experiments were analyzed using two-tailed unpaired t test. Data are presented as mean ± SEM. Significance was set at *p < 0.05 and **p < 0.01.
Figure 7
Figure 7
A20 limits development of thymic Treg cell progenitors. (A) Thymocytes of adult CD4 A20+/+ and CD4 A20−/− mice were stained with anti-CD4, anti-CD8, anti-CD25, anti-Foxp3, anti-GITR, and live/dead reagent. The population of CD4+ CD8 CD25+ Foxp3 GITR+ live cells was determined by flow cytometry. Gating strategy and representative FACS plots of cells that were previously gated on single, live CD4+ CD8 (CD4SP) thymocytes are depicted. (B) Frequencies of CD25+ Foxp3 of CD4SP live cells were determined by flow cytometry. Pooled data of three independent experiments are shown. Animal numbers per group (n) are depicted. (C) Frequencies of GITR+ cells of CD25+ Foxp3 CD4SP cells (left panel), frequencies of GITR+ CD25+ Foxp3 of CD4SP live cells (middle panel), and mean GITR expression of CD25+ Foxp3 CD4SP live cells (right panel) were determined by flow cytometry. Pooled data of two independent experiments are shown. Animal numbers per group (n) are depicted. Experiments were analyzed using two-tailed unpaired t test. Data are presented as mean ± SEM. Significance was set at **p < 0.01 and ***p < 0.001.
Figure 8
Figure 8
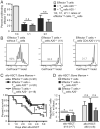
A20-deficient Treg cells are functional. (A) MACS-sorted A20+/+ or A20−/− CD4+ CD25 T effector cells were labeled with a cell tracer dye (CellTrace Violet) and cultured together with CD4+ CD25+ Treg cells in the presence of plate-bound anti-CD3 and irradiated APCs at different ratios. Numbers of proliferating effector T (Teff) cells were determined on day 4. Pooled data of two independent experiments are shown. (B) Gating strategy and representative histograms of labeled Teff cells of one representative experiment described in (A). (C) Survival curve of allo-HSCT recipient mice (BALB/c) after 9 Gy TBI + 5 × 10⁶ T cell–depleted BM cells + 2 × 10⁵ CD4+ CD25 + 2 × 10⁵ CD8+ T cells (C57BL/6) and either 6 × 10⁵ A20+/+ or A20−/− CD4+ CD25+ Treg cells (C57BL/6). Pooled data of three independent experiments are shown. Animal numbers per group (n) are depicted. (D) Number of donor-derived Treg cells in the blood of allo-HSCT recipient mice that were transplanted as described in (C). Blood was taken at indicated time points. The experiment was performed once. Animal numbers per group (n) are depicted. Survival was analyzed using the log-rank test. Other experiments were analyzed using two-tailed unpaired t test. Data are presented as mean ± SEM. Significance was set at *p < 0.05 and **p < 0.01.

Similar articles

Cited by

References

    1. Fontenot JD, Gavin MA, Rudensky AY. Foxp3 programs the development and function of CD4+CD25+ regulatory T cells. Nat Immunol. 2003;4:330–336. - PubMed
    1. Hori S, Nomura T, Sakaguchi S. Control of regulatory T cell development by the transcription factor Foxp3. Science. 2003;299:1057–1061. - PubMed
    1. Hsieh CS, Lee HM, Lio CW. Selection of regulatory T cells in the thymus. Nat Rev Immunol. 2012;12:157–167. - PubMed
    1. Huehn J, Polansky JK, Hamann A. Epigenetic control of FOXP3 expression: the key to a stable regulatory T-cell lineage? Nat Rev Immunol. 2009;9:83–89. - PubMed
    1. Thome M, Charton JE, Pelzer C, Hailfinger S. Antigen receptor signaling to NF-kappaB via CARMA1, BCL10, and MALT1. Cold Spring Harb Perspect Biol. 2010;2:a003004. - PMC - PubMed

Publication types

MeSH terms