

Cost-Effectiveness of Intensive versus Standard Blood-Pressure Control
- PMID: 28834469
- PMCID: PMC5708850
- DOI: 10.1056/NEJMsa1616035
Cost-Effectiveness of Intensive versus Standard Blood-Pressure Control
Abstract
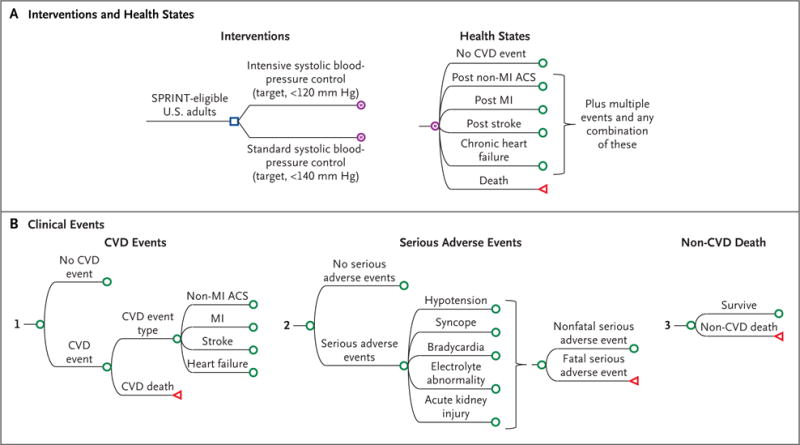
Background: In the Systolic Blood Pressure Intervention Trial (SPRINT), adults at high risk for cardiovascular disease who received intensive systolic blood-pressure control (target, <120 mm Hg) had significantly lower rates of death and cardiovascular disease events than did those who received standard control (target, <140 mm Hg). On the basis of these data, we wanted to determine the lifetime health benefits and health care costs associated with intensive control versus standard control.
Methods: We used a microsimulation model to apply SPRINT treatment effects and health care costs from national sources to a hypothetical cohort of SPRINT-eligible adults. The model projected lifetime costs of treatment and monitoring in patients with hypertension, cardiovascular disease events and subsequent treatment costs, treatment-related risks of serious adverse events and subsequent costs, and quality-adjusted life-years (QALYs) for intensive control versus standard control of systolic blood pressure.
Results: We determined that the mean number of QALYs would be 0.27 higher among patients who received intensive control than among those who received standard control and would cost approximately $47,000 more per QALY gained if there were a reduction in adherence and treatment effects after 5 years; the cost would be approximately $28,000 more per QALY gained if the treatment effects persisted for the remaining lifetime of the patient. Most simulation results indicated that intensive treatment would be cost-effective (51 to 79% below the willingness-to-pay threshold of $50,000 per QALY and 76 to 93% below the threshold of $100,000 per QALY), regardless of whether treatment effects were reduced after 5 years or persisted for the remaining lifetime.
Conclusions: In this simulation study, intensive systolic blood-pressure control prevented cardiovascular disease events and prolonged life and did so at levels below common willingness-to-pay thresholds per QALY, regardless of whether benefits were reduced after 5 years or persisted for the patient's remaining lifetime. (Funded by the National Heart, Lung, and Blood Institute and others; SPRINT ClinicalTrials.gov number, NCT01206062 .).
Figures


Comment in
-
Cost-Effectiveness of Intensive versus Standard Blood-Pressure Control.N Engl J Med. 2017 Nov 30;377(22):2199. doi: 10.1056/NEJMc1712465. N Engl J Med. 2017. PMID: 29188982 No abstract available.
Similar articles
-
Cost-effectiveness of Intensive vs Standard Blood Pressure Control Among Older Patients With Hypertension.JAMA Netw Open. 2023 Feb 1;6(2):e230708. doi: 10.1001/jamanetworkopen.2023.0708. JAMA Netw Open. 2023. PMID: 36848091 Free PMC article.
-
Applicability and cost-effectiveness of the Systolic Blood Pressure Intervention Trial (SPRINT) in the Chinese population: A cost-effectiveness modeling study.PLoS Med. 2021 Mar 4;18(3):e1003515. doi: 10.1371/journal.pmed.1003515. eCollection 2021 Mar. PLoS Med. 2021. PMID: 33661907 Free PMC article. Clinical Trial.
-
Cost-effectiveness of Intensive Blood Pressure Management.JAMA Cardiol. 2016 Nov 1;1(8):872-879. doi: 10.1001/jamacardio.2016.3517. JAMA Cardiol. 2016. PMID: 27627731 Free PMC article.
-
Adefovir dipivoxil and pegylated interferon alfa-2a for the treatment of chronic hepatitis B: a systematic review and economic evaluation.Health Technol Assess. 2006 Aug;10(28):iii-iv, xi-xiv, 1-183. doi: 10.3310/hta10280. Health Technol Assess. 2006. PMID: 16904047 Review.
-
The clinical effectiveness and cost-effectiveness of cardiac resynchronisation (biventricular pacing) for heart failure: systematic review and economic model.Health Technol Assess. 2007 Nov;11(47):iii-iv, ix-248. doi: 10.3310/hta11470. Health Technol Assess. 2007. PMID: 17999842 Review.
Cited by
-
The role of affective temperaments in self-care and medication adherence among individuals with bipolar disorder: a moderation analysis.Front Psychiatry. 2024 Sep 11;15:1443278. doi: 10.3389/fpsyt.2024.1443278. eCollection 2024. Front Psychiatry. 2024. PMID: 39323967 Free PMC article.
-
Association of short term exposure to Asian dust with increased blood pressure.Sci Rep. 2020 Oct 19;10(1):17630. doi: 10.1038/s41598-020-74713-6. Sci Rep. 2020. PMID: 33077773 Free PMC article.
-
Adherence to antihypertensive medication and its associated factors among patients with hypertension attending a tertiary hospital in Kathmandu, Nepal.PLoS One. 2024 Jul 3;19(7):e0305941. doi: 10.1371/journal.pone.0305941. eCollection 2024. PLoS One. 2024. PMID: 38959196 Free PMC article.
-
A Mobile Applet for Assessing Medication Adherence and Managing Adverse Drug Reactions Among Patients With Cancer: Usability and Utility Study.JMIR Form Res. 2024 Feb 29;8:e50528. doi: 10.2196/50528. JMIR Form Res. 2024. PMID: 38421700 Free PMC article.
-
Cost-effectiveness of Intensive vs Standard Blood Pressure Control Among Older Patients With Hypertension.JAMA Netw Open. 2023 Feb 1;6(2):e230708. doi: 10.1001/jamanetworkopen.2023.0708. JAMA Netw Open. 2023. PMID: 36848091 Free PMC article.
References
-
- James PA, Oparil S, Carter BL, et al. 2014 Evidence-based guideline for the management of high blood pressure in adults: report from the panel members appointed to the Eighth Joint National Committee (JNC 8) JAMA. 2014;311:507–20. - PubMed
Publication types
MeSH terms
Substances
Associated data
Grants and funding
LinkOut - more resources
Full Text Sources
Other Literature Sources
Medical