Cardiac injury of the newborn mammalian heart accelerates cardiomyocyte terminal differentiation
- PMID: 28827644
- PMCID: PMC5567176
- DOI: 10.1038/s41598-017-08947-2
Cardiac injury of the newborn mammalian heart accelerates cardiomyocyte terminal differentiation
Abstract
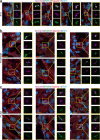
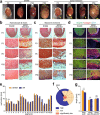
After birth cardiomyocytes undergo terminal differentiation, characterized by binucleation and centrosome disassembly, rendering the heart unable to regenerate. Yet, it has been suggested that newborn mammals regenerate their hearts after apical resection by cardiomyocyte proliferation. Thus, we tested the hypothesis that apical resection either inhibits, delays, or reverses cardiomyocyte centrosome disassembly and binucleation. Our data show that apical resection rather transiently accelerates centrosome disassembly as well as the rate of binucleation. Consistent with the nearly 2-fold increased rate of binucleation there was a nearly 2-fold increase in the number of cardiomyocytes in mitosis indicating that the majority of injury-induced cardiomyocyte cell cycle activity results in binucleation, not proliferation. Concurrently, cardiomyocytes undergoing cytokinesis from embryonic hearts exhibited midbody formation consistent with successful abscission, whereas those from 3 day-old cardiomyocytes after apical resection exhibited midbody formation consistent with abscission failure. Lastly, injured hearts failed to fully regenerate as evidenced by persistent scarring and reduced wall motion. Collectively, these data suggest that should a regenerative program exist in the newborn mammalian heart, it is quickly curtailed by developmental mechanisms that render cardiomyocytes post-mitotic.
Conflict of interest statement
The authors declare that they have no competing interests.
Figures


Similar articles
-
Developmental alterations in centrosome integrity contribute to the post-mitotic state of mammalian cardiomyocytes.Elife. 2015 Aug 6;4:e05563. doi: 10.7554/eLife.05563. Elife. 2015. PMID: 26247711 Free PMC article.
-
Newborn hypoxia/anoxia inhibits cardiomyocyte proliferation and decreases cardiomyocyte endowment in the developing heart: role of endothelin-1.PLoS One. 2015 Feb 18;10(2):e0116600. doi: 10.1371/journal.pone.0116600. eCollection 2015. PLoS One. 2015. PMID: 25692855 Free PMC article.
-
RNA-Binding Protein LIN28a Regulates New Myocyte Formation in the Heart Through Long Noncoding RNA-H19.Circulation. 2023 Jan 24;147(4):324-337. doi: 10.1161/CIRCULATIONAHA.122.059346. Epub 2022 Oct 31. Circulation. 2023. PMID: 36314132 Free PMC article.
-
Cardiomyocyte proliferation in cardiac development and regeneration: a guide to methodologies and interpretations.Am J Physiol Heart Circ Physiol. 2015 Oct;309(8):H1237-50. doi: 10.1152/ajpheart.00559.2015. Epub 2015 Sep 4. Am J Physiol Heart Circ Physiol. 2015. PMID: 26342071 Review.
-
Regulation of cardiomyocyte proliferation during development and regeneration.Dev Growth Differ. 2014 Jun;56(5):402-9. doi: 10.1111/dgd.12134. Epub 2014 Apr 16. Dev Growth Differ. 2014. PMID: 24738847 Review.
Cited by
-
Neonatal Apex Resection Triggers Cardiomyocyte Proliferation, Neovascularization and Functional Recovery Despite Local Fibrosis.Stem Cell Reports. 2018 Mar 13;10(3):860-874. doi: 10.1016/j.stemcr.2018.01.042. Epub 2018 Mar 1. Stem Cell Reports. 2018. PMID: 29503089 Free PMC article.
-
Asparagine Synthetase Marks a Distinct Dependency Threshold for Cardiomyocyte Dedifferentiation.Circulation. 2024 Jun 4;149(23):1833-1851. doi: 10.1161/CIRCULATIONAHA.123.063965. Epub 2024 Apr 8. Circulation. 2024. PMID: 38586957
-
YAP/TAZ: Molecular pathway and disease therapy.MedComm (2020). 2023 Aug 9;4(4):e340. doi: 10.1002/mco2.340. eCollection 2023 Aug. MedComm (2020). 2023. PMID: 37576865 Free PMC article. Review.
-
Telomeres and Telomerase in Heart Ontogenesis, Aging and Regeneration.Cells. 2020 Feb 22;9(2):503. doi: 10.3390/cells9020503. Cells. 2020. PMID: 32098394 Free PMC article. Review.
-
Right ventricular cardiomyocyte expansion accompanies cardiac regeneration in newborn mice after large left ventricular infarcts.JCI Insight. 2024 Feb 6;9(5):e176281. doi: 10.1172/jci.insight.176281. JCI Insight. 2024. PMID: 38319719 Free PMC article.
References
Publication types
MeSH terms
LinkOut - more resources
Full Text Sources
Other Literature Sources

