. 2017 Oct;18(10):1104-1116.
doi: 10.1038/ni.3818. Epub 2017 Aug 21.

Type I interferons and the cytokine TNF cooperatively reprogram the macrophage epigenome to promote inflammatory activation

Affiliations

Type I interferons and the cytokine TNF cooperatively reprogram the macrophage epigenome to promote inflammatory activation

Sung Ho Park et al. Nat Immunol. 2017 Oct.

Abstract

Cross-regulation of Toll-like receptor (TLR) responses by cytokines is essential for effective host defense, avoidance of toxicity and homeostasis, but the underlying mechanisms are not well understood. Our comprehensive epigenomics approach to the analysis of human macrophages showed that the proinflammatory cytokines TNF and type I interferons induced transcriptional cascades that altered chromatin states to broadly reprogram responses induced by TLR4. TNF tolerized genes encoding inflammatory molecules to prevent toxicity while preserving the induction of genes encoding antiviral and metabolic molecules. Type I interferons potentiated the inflammatory function of TNF by priming chromatin to prevent the silencing of target genes of the transcription factor NF-κB that encode inflammatory molecules. The priming of chromatin enabled robust transcriptional responses to weak upstream signals. Similar chromatin regulation occurred in human diseases. Our findings reveal that signaling crosstalk between interferons and TNF is integrated at the level of chromatin to reprogram inflammatory responses, and identify previously unknown functions and mechanisms of action of these cytokines.


Figures
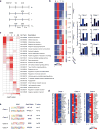
Figure 1
Figure 1
Pretreatment with TNF reprograms subsequent TLR4 response in human macrophages. (a) Experimental design: N, no treatment; L, no pretreatment, followed by LPS challenge; T, pretreatment with TNF; T-L, pretreatment with TNF and challenge with LPS; hCD14+, human CD14 positive monocyte-derived macrophages. (b) K-means clustering (K = 12) of 1,574 LPS-induced genes (>3-fold) in the indicated conditions; heat map shows gene expression relative to maximum, set at 1. 12 clusters were assembled into 6 major Classes (see Methods). Bar graphs represent pooled data from three biological replicates (% of maximum value) for a given class. (c) Functionally enriched Gene Ontology (GO) categories of the gene classes in Fig. 1b. (d) Heatmaps of representative genes from Classes 1, 3, and 4 that correspond to distinct biological functions. (e) Motifs enriched in the promoters (−300bp < TSS < +50bp) of given Class genes using GC-corrected background set of all other promoters using HOMER. Data (c–e) are representative of three biological replicates with similar results.
Figure 2
Figure 2
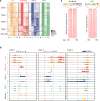
Distinct epigenetic landscape at different TLR4-induced gene classes. (a) Heatmaps of H4ac, H3K4me3, H2Bub ChIP-seq and ATAC-seq normalized tag densities at the promoters (−2kb < TSS < +2kb) of a given gene class based on Fig. 1b. The order of genes in each column is the same for all heatmaps and Fig. 1b. (see Supplementary Fig. 3a for quantitation). (b) Representative UCSC Genome Browser tracks displaying normalized tag density profiles for H4ac, H3K4me3, H2Bub ChIP-seq, ATAC-seq and RNA-seq signals at IL6 (Class 1), CCL5 (Class 3), and CH25H (Class 4) genes in the indicated conditions. Boxes enclose genomic regions showing differential regulation. Data (a and b) show results from one representative donor; results from biological replicates (ChIP-seq) and pooled data from 3–5 replicates (ATAC-seq) are shown in Supplementary Fig. 4a. (c) Heatmaps showing per nucleotide ATAC-seq cleavage sites for NFκB-p65 and PU.1 motifs in LPS-stimulated human primary macrophages ranked by tag density. The number of ATAC-seq footprints for each TF is shown on y-axis. 200 bp windows are shown centered at the midpoints of the ATAC-seq footprint. Footprinting was performed with two independent ATAC-seq replicates.
Figure 3
Figure 3
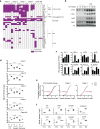
(a–c) Distinct transcription factor binding at different gene classes. (a) Heatmap of significantly enriched motifs (p < 10−5) within ATAC-seq footprints (p < 10−10) in gene class promoter regions (−2kb < TSS < +2kb) in indicated conditions. Motifs are grouped according to transcription factor families. (b) Immunoblot of nuclear lysates from macrophages stimulated overnight with TNF. (c) Bar graphs show cumulative values for representative TFs that match motifs in (a) from three replicates. (d–e) Expression of inflammatory gene classes in sepsis monocytes and RA synovial macrophages. (d) Expression of genes belonging to each gene class in healthy donor monocytes (CTL, n = 2), or monocytes from patients during sepsis (Sepsis, n = 7) and after recovery from sepsis (Recovery, n = 7) stimulated ex vivo with or without LPS. Each dot represents the average (log2) of a gene class in an individual donor. Data are presented as mean ± SEM. The gene expression data are from GSE46955. ****p < 0.0001, **p<0.01, analysis of variance and Dunnett’s multiple comparison post hoc test. (e) Cumulative distribution plot of normalized gene expression (log2) of LPS-inducible, Class 3 and Class 4 genes in RA synovial macrophages (RA, n=8) and control macrophages (CTL, n=8). p-value: CTL vs. RA, Kolmogorov-Smirnov test. (f) Expression of representative Class 4 genes in control or RA macrophages. Data are presented as mean ± SEM. **** p < 0.0001, *** p < 0.001, ** p < 0.01, * p < 0.05, unpaired Student’s t-test.
Figure 4
Figure 4
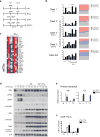
Type I IFNs block TNF-mediated tolerization of inflammatory genes without affecting LPS signaling. (a) Experimental design: IFN, treatment with IFN-α (25 ng/ml); IFN-L, treatment with IFN-α, followed by LPS challenge (10 ng/ml); IFN/T, treatment with IFN-α and TNF (10 ng/ml); IFN/T-L, treatment with IFN-α and TNF, followed by LPS. (b) Bar graphs represent cumulative values for a given gene class in RNA-seq analysis (left) from three replicates (% of maximum value). Error bars indicate SEM. The dot plots (right) show percent of genes in each class that were up-regulated, down-regulated or not changed by IFN-α (>1.5-fold, T-L vs. IFN/T-L). Each dot represents 1% of genes; red = upregulated, blue = downregulated, grey = not changed. ****p < 0.0001, *p<0.05, analysis of variance and Dunnett’s multiple comparison post hoc test. (c) Heatmap showing inflammatory Class 1 genes whose tolerization is reversed by IFN-α treatment. (d) Immunoblot analysis of IκBα, p105/p50, cRel, p100/p52, RelB and phosphorylated IKKβ, ERK and STAT1 in primary macrophages cultured for 24 h with TNF (10 ng/ml) with or without IFN-α (25 ng/ml), and challenged for the indicated times with LPS (10 ng/ml). Data are representative of four experiments. (e) RT-qPCR analysis of TNF and IL6 primary transcripts normalized relative to HPRT. Data are representative of five independent donors and error bars indicate SEM. (f) ChIP assays for recruitment of Pol II to IL6 promoter in the indicated conditions. Data are representative of 4 different donors.
Figure 5
Figure 5
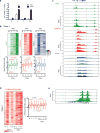
Integration of signaling crosstalk between IFN and TNF at the chromatin level. (a) Formaldehyde-assisted isolation of regulatory elements (FAIRE) assay at IL6 gene under indicated conditions. Data are representative of 4 experiments; error bars show SEM. (b) Heatmaps of ATAC-seq and H3K4me3, H2Bub ChIP-seq normalized tag densities at the promoters (−2kb < TSS < +2kb) of Class 1 genes ordered as in Fig. 1b (upper). Box graphs represent quantitation of the normalized tag densities (log2) for the indicated conditions. p value, Kolmogorov-Smirnov test. (c) Representative UCSC Genome Browser tracks displaying normalized profiles for ATAC-seq, H3K4me3 and H2Bub ChIP-seq signals at TNF gene under indicated conditions. ATAC-seq data represents pooled data from three to five biological replicates. (d) Heatmap of breadth of H3K4me3 ChIP-seq peaks at Class 1 gene promoters under indicated conditions (upper). Box graphs represent quantification of the H3K4me3 breadth (log2) for Class 1 genes (lower). p-value, Kolmogorov-Smirnov test. (e) Representative UCSC Genome Browser tracks displaying normalized profiles for ATAC-seq signals at IL1B, DUSP2 and NFKBIA (Class 1) genes under indicated conditions. Boxes enclose ATAC-seq peaks that extended into gene bodies in IFN/T-L condition.
Figure 6
Figure 6
IFN and TNF prime chromatin by cooperatively recruiting transcription factors to Class 1 promoters. (a) De novo motif enrichment analysis of promoter regions (−2kb < TSS < +2kb) of Class 1 genes using ATAC-seq footprints of IFN/T-L condition. Random background regions were selected as a control. (b) Graphs represent association of occupied transcription factor binding sites (footprints) with chromatin accessibility and histone modifications. Data are presented as mean ± SEM. Relative chromatin accessibility or histone modification (x-axis, normalized ATAC-seq, H2Bub or H3K4me3 tag counts) is measured as the mean intensity of ATAC-seq, H2Bub or H3K4me3 peaks containing the indicated motif (y-axis) across all experimental conditions. (c) Bar graphs represent cumulative values for IRF1, 4 and 7 in RNA-seq analysis from three replicates.
Figure 7
Figure 7
(a–c) Colocalization of IRF1 and NF-kB p65 in IFN-α and TNF-treated macrophages. (a) Circle represents 100% of Class 1 gene promoter IRF1 Chip-seq peaks in unstimulated (left, n = 147) or IFNα/T conditions (right, n = 386). The peak fraction that overlaps with p65 ChIP-seq peaks is shaded in black. P value was calculated relative to random genes. (b) Representative UCSC Genome Browser tracks displaying normalized profiles for p65 and IRF1 ChIP-seq signals at IL1B and CCL3 genes in indicated conditions. Boxes enclose co-localization of p65 and IRF1 binding peaks in the same genomic regions. (c) ChIP-qPCR analysis of recruitment of p65 and IRF1 to CCL3 and CCL20 promoters. Data are representative of three independent experiments. (d–e) Altered transcriptional requirements in IFN-α + TNF-treated macrophages. Naïve, TNF-, or IFN-α + TNF-treated macrophages were stimulated with LPS (10 ng/ml) with or without CHX (d, 20 µg/mL) or IL-10 (e, 10 ng/ml) and RT–qPCR was performed. Data are representative of three independent donors, and error bars indicate SEM.
Figure 8
Figure 8
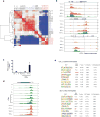
Chromatin accessibility in SLE monocytes. (a) Correlation matrix heatmap based on unsupervised Pearson correlation coefficients comparing normalized ATAC-seq tag densities at promoters (−2kb < TSS < +2kb) of Class 1 genes across all indicated conditions and replicates. (SLE-N: untreated SLE monocytes, SLE-L: LPS (10 ng/ml)-treated SLE monocytes). (b) Representative UCSC Genome Browser tracks displaying normalized profiles for ATAC-seq signals at TNF, CXCL2 and CCL20 genes in indicated conditions. (CTL: control monocytes, SLE: SLE monocytes). Boxes enclose a broad region of chromatin accessibility that extends into the gene bodies in SLE monocytes. (c) Bar graph represents cumulative values for IFNB1 in RNA-seq analysis under indicated conditions from three replicates. (d) UCSC Genome Browser tracks displaying normalized profiles for ATAC-seq signals at IFNB1 under indicated conditions. (CTL: control monocytes, SLE: SLE monocytes). Boxes enclose a broad region of chromatin accessibility that extends into the gene bodies in IFN/T-L and SLE-L conditions. (e) De novo motif enrichment analysis of Class 1 gene promoters using ATAC-seq footprints of LPS-stimulated control monocytes (CTL-L) and SLE monocytes (SLE-L).

Comment in

Similar articles

Cited by

References

    1. Brenner D, Blaser H, Mak TW. Regulation of tumour necrosis factor signalling: live or let die. Nature reviews. Immunology. 2015;15:362–374. doi: 10.1038/nri3834. - DOI - PubMed
    1. Kalliolias GD, Ivashkiv LB. TNF biology, pathogenic mechanisms and emerging therapeutic strategies. Nature reviews. Rheumatology. 2016;12:49–62. doi: 10.1038/nrrheum.2015.169. - DOI - PMC - PubMed
    1. Park SH, Park-Min KH, Chen J, Hu X, Ivashkiv LB. Tumor necrosis factor induces GSK3 kinase-mediated cross-tolerance to endotoxin in macrophages. Nature immunology. 2011;12:607–615. doi: 10.1038/ni.2043. - DOI - PMC - PubMed
    1. Hu X, Ivashkiv LB. Cross-regulation of signaling pathways by interferon-gamma: implications for immune responses and autoimmune diseases. Immunity. 2009;31:539–550. doi: 10.1016/j.immuni.2009.09.002. - DOI - PMC - PubMed
    1. Biswas SK, Lopez-Collazo E. Endotoxin tolerance: new mechanisms, molecules and clinical significance. Trends in immunology. 2009;30:475–487. doi: 10.1016/j.it.2009.07.009. - DOI - PubMed

MeSH terms