. 2017 Oct 3;13(10):1679-1696.
doi: 10.1080/15548627.2017.1353841. Epub 2017 Aug 18.

Mir505-3p regulates axonal development via inhibiting the autophagy pathway by targeting Atg12

Affiliations

Mir505-3p regulates axonal development via inhibiting the autophagy pathway by targeting Atg12

Kan Yang et al. Autophagy. .

Abstract

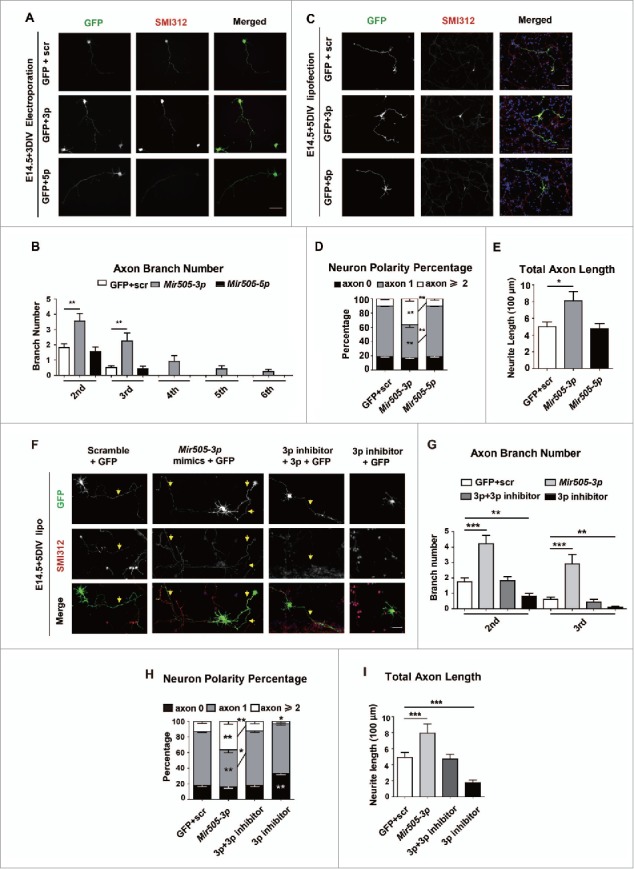
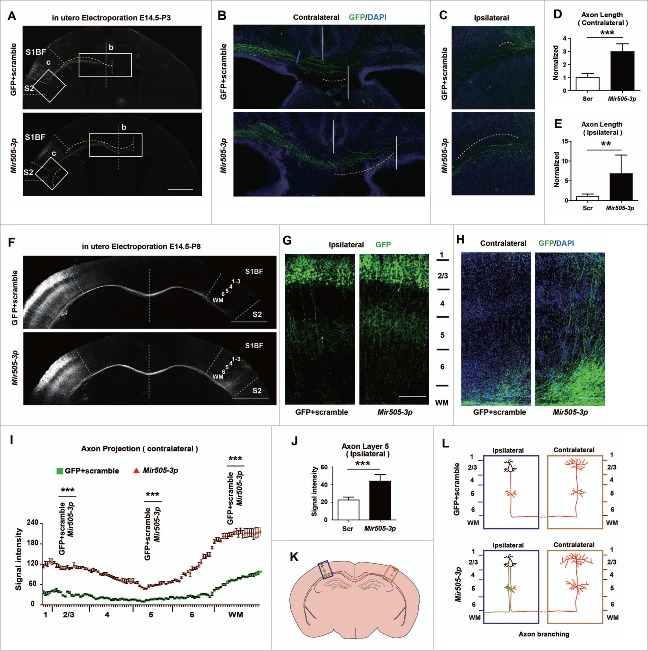
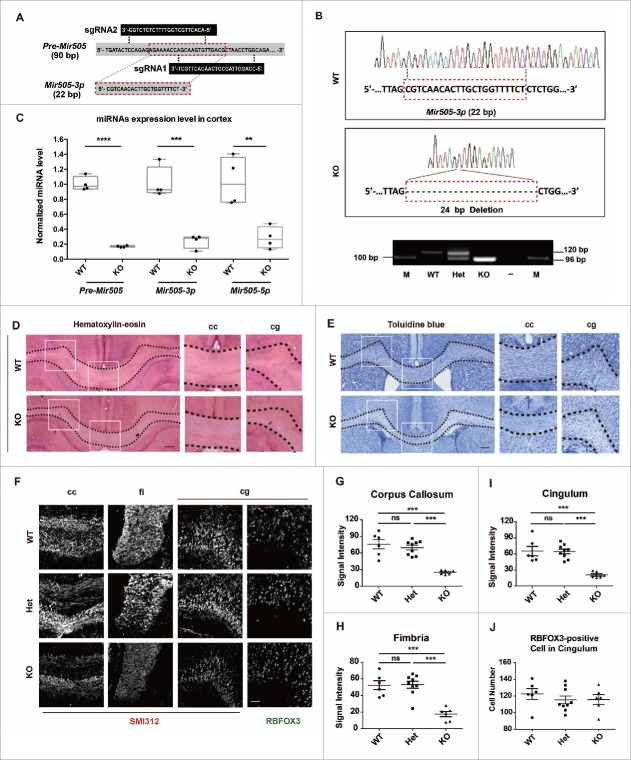
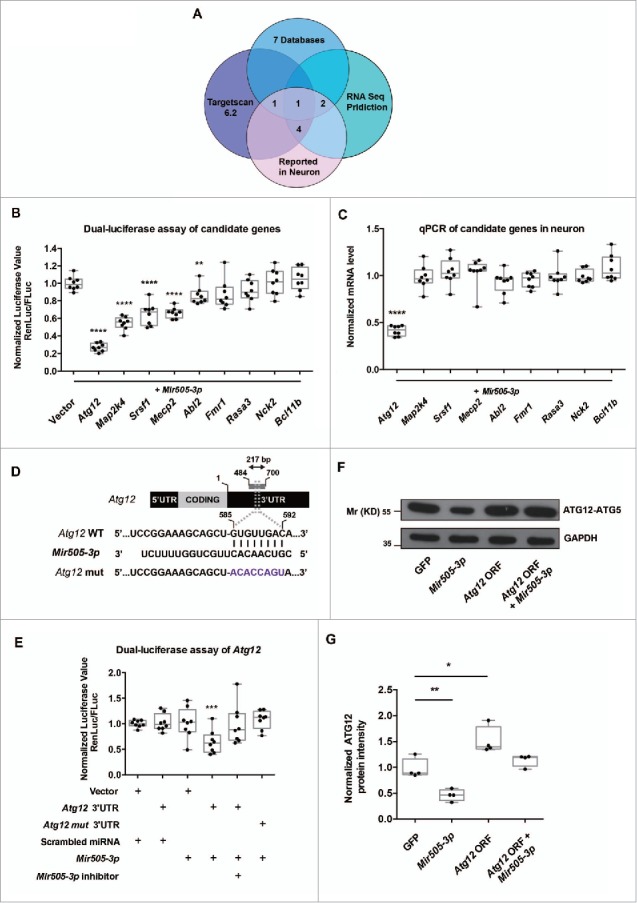
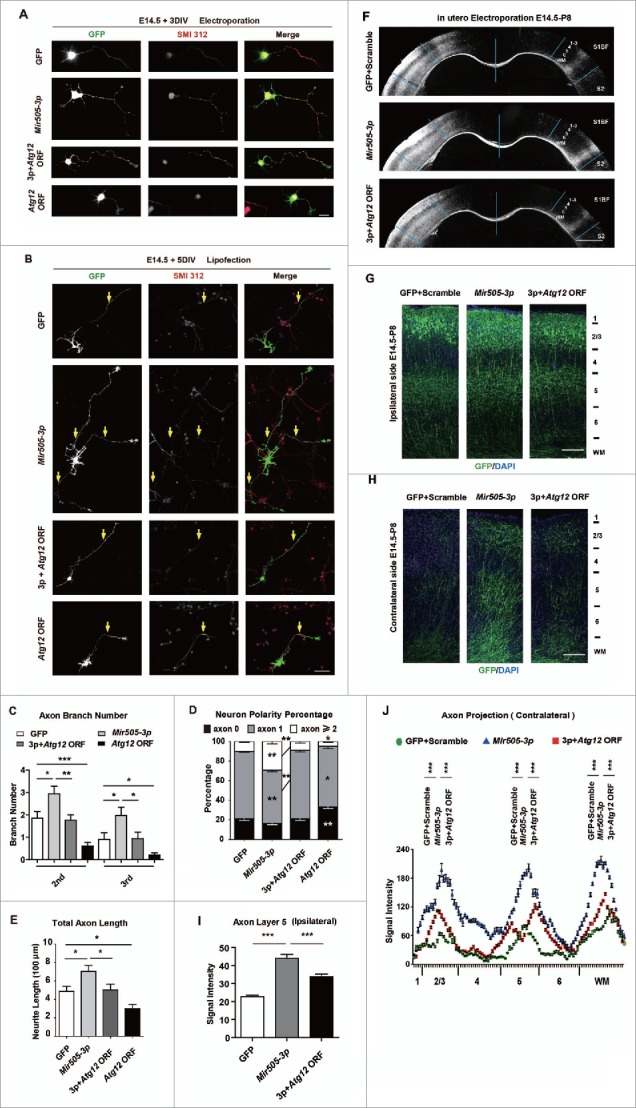
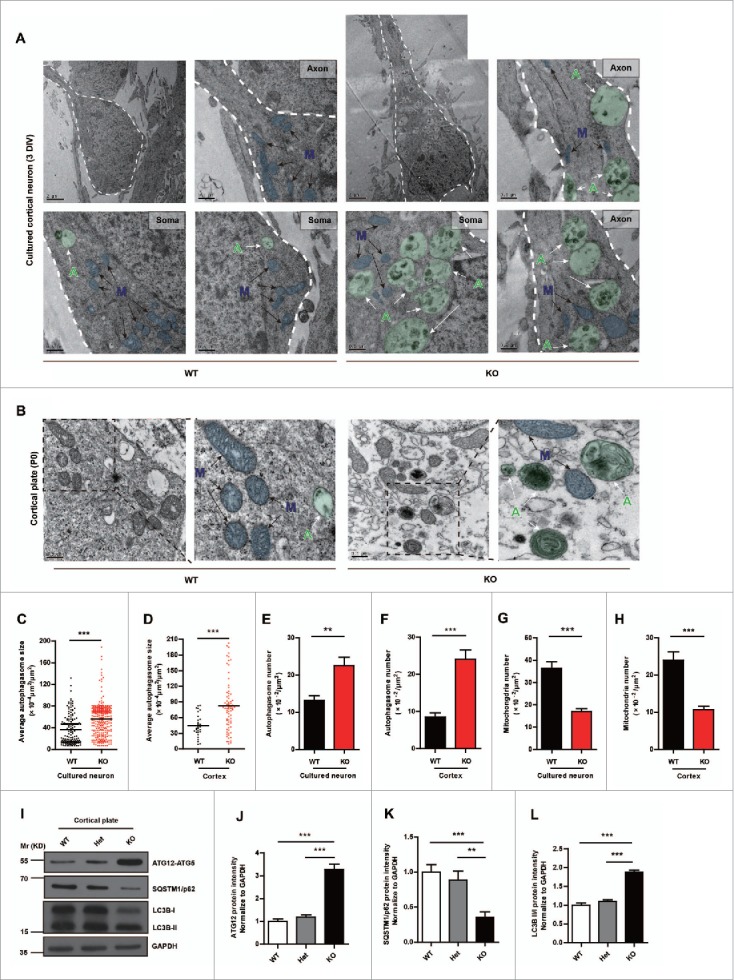
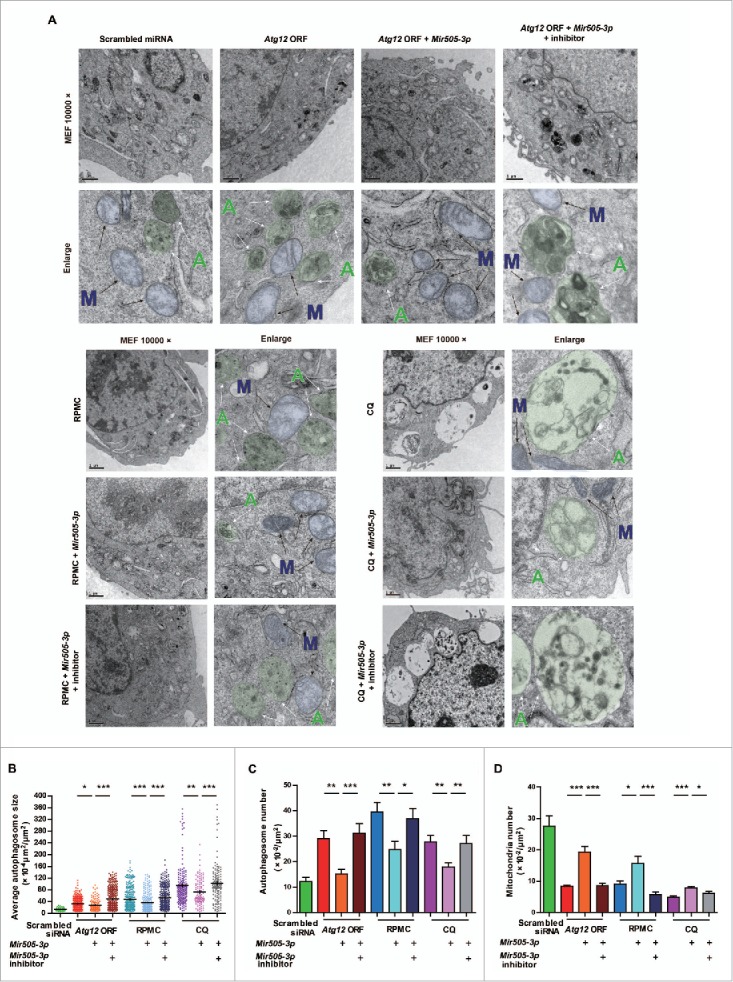
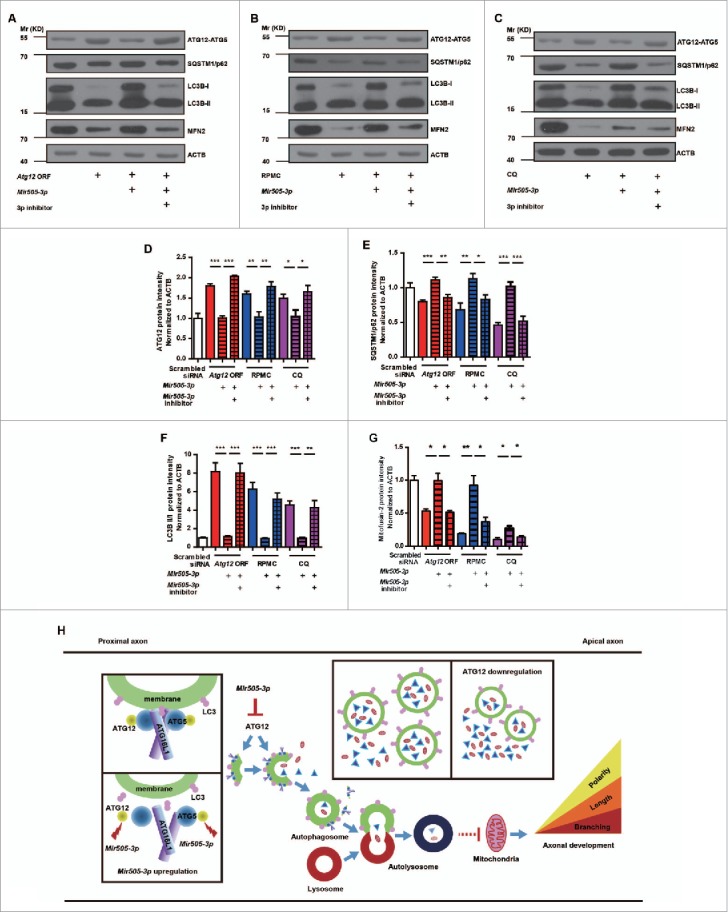
In addition to the canonical role in protein homeostasis, autophagy has recently been found to be involved in axonal dystrophy and neurodegeneration. Whether autophagy may also be involved in neural development remains largely unclear. Here we report that Mir505-3p is a crucial regulator for axonal elongation and branching in vitro and in vivo, through modulating autophagy in neurons. We identify that the key target gene of Mir505-3p in neurons is Atg12, encoding ATG12 (autophagy-related 12) which is an essential component of the autophagy machinery during the initiation and expansion steps of autophagosome formation. Importantly, axonal development is compromised in brains of mir505 knockout mice, in which autophagy signaling and formation of autophagosomes are consistently enhanced. These results define Mir505-3p-ATG12 as a vital signaling cascade for axonal development via the autophagy pathway, further suggesting the critical role of autophagy in neural development.

Keywords: ATG12; Mir505–3p; autophagy; axonal development; microRNA.


Figures

Figure 1.
Figure 1.
Mir505–3p is required for axonal development in vitro. (A) Example pictures of mouse primary cortical neurons transfected with the AMAXA nucleofector at 0 DIV with GFP and scrambled siRNA or GFP with constructs as indicated. Neurons were fixed and stained for immunofluorescence with anti-SMI312 and GFP antibodies at 3 DIV for measurement of numbers of axon and minor neurites. Scale bar: 50 μm. (B) Measurements of axon numbers in each condition of (A). (C) Example pictures of mouse primary cortical neurons transfected with Lipofectamine 2000 at 1 DIV with GFP and scrambled siRNA or GFP with constructs as indicated. Neurons were fixed at 5 DIV for measurement of neuron polarity and total axon length. Scale bar: 90 μm. (D) Measurements of neuron polarity of each condition in (C). (E) Measurements of total axon length of each condition in (C). (F) Example pictures of mouse primary cortical neurons transfected with Lipofectamine 2000 at 1 DIV with GFP and scrambled siRNA or GFP with constructs as indicated. Scale bar: 45 μm. ((G)to I) Measurements of axon numbers, neuron polarity and total axon length of each condition, respectively. A total 30 to 33 neurons from each condition were randomly selected and measured. Error bars: SEM. *P < 0.05, **P < 0.01, *** P < 0.001 (Student t test).
Figure 2.
Figure 2.
Mir505–3p is sufficient for axonal extension and branching in vivo. (A) Low-magnification images of coronal brain sections of P3 mice in utero electroporated at E 14.5 with the indicated plasmids. Scale bar: 1000 μm. (B) Magnification images of contralateral brain sections in (A). (C) Magnification images of ipsilateral brain sections in (A). (D) Measurements of axon length (from middle line to terminus of axon bundle, indicated by yellow line) in (B). (E) Measurements of axon length (from proximal region to terminus of axon bundle, indicated by yellow line) in (C). (F) Low-magnification images of coronal brain sections of P8 mice in utero electroporated at E 14.5 with plasmids as indicated. Scale bar: 1000 μm. (G) Magnification images of ipsilateral brain sections in (F). Scale bar: 100 μm. (H) Magnification images of contralateral brain sections in (F). Scale bar: 100 μm. (I) Measurements of axonal signal intensity in contralateral cortical plate from layer 1 to white matter of each condition in (H). (J) Measurements of axonal signal intensity in ipsilateral cortical plate layer 5 of each condition in (G). (K) Schematic diagram of coronal brain sections of P8 mice. Boxes with the indicated regions were further illustrated in (L). (L) Schematic diagram of axonal branching morphology in IUE model of each condition. At least 4 litters for each condition were measured. Error bars: SEM. **P < 0.01, *** P < 0.001 (Student t test).
Figure 3.
Figure 3.
Genetic deletion of Mir505–3p impairs axon development in vivo. (A) Schematic diagram of 2 sgRNAs targeting pre-Mir505. (B) Sequencing results show a total deletion of Mir505–3p induced by CRISPR/Cas9 system (upper). DNA gel electrophoresis show genotyping results of WT, heterozygous and KO littermates (lower). A 24 bp deletion mutation was generated by the CRISPR/Cas9 system. (C) Examination of mRNA levels of Pre-Mir505, Mir505–3p and Mir505–5p in mir505 KO mice comparing to WT littermates by Q-PCR. (D and E) Coronal brain sections of mature mice with hematoxylin-eosin (D) and toluidine blue staining (E). Alteration of axon morphology is indicated by dotted lines. Corpus callosum (cc) and cingulum (cg) regions were amplified to represent loss of axon bundles in KO mice. Scale bar: 100 μm. (F) Magnification images of the indicated regions of each genotype. Immunostaining was performed with anti-SMI312 and RBFOX3 antibodies. Scale bar: 50 μm. Het, heterozygous. (G to I) Measurements of axon signal intensity in cc (G), fi (H) and cg (I) regions of mice of each genotype, respectively. (J) Measurements of RBFOX3-positive cells in cingulum of mice of each genotype. For immunostaining on brain slices, at least 4 litters for each condition were measured. Error bars are SEM. ** P < 0.05, *** P < 0.001 (t test).
Figure 4.
Figure 4.
Atg12 is a direct target gene of Mir505–3p in mouse cortical neuron. (A) Schematic diagram of bioinformation screen of candidate target genes of Mir505–3p in mouse cortical neurons. See also Table S1. (B) Normalized luciferase (Renilla:firefly) values of all candidate targets. The seed match region of 3′UTR of candidate targets were cloned into psi-CHECK-2 dual-luciferase vector and cotransfected with Mir505–3p plasmid in the HEK 293 cell line. (C) Q-PCR examination of mRNA levels of all candidate targets in cultured cortical neuron with lentivirus infection to overexpress Mir505–3p. (D) Schematic diagram of the exact position which Mir505–3p targets on the mouse Atg12 3′UTR. Seed match region was replaced in a site-directed mutation experiment. (E) Normalized luciferase (Renilla:firefly) values are shown. The Atg12 3′UTR psi-CHECK-2 vector was cotransfected with the constructs as indicated. Mir505–3p exhibited a specific inhibition on Atg12 WT 3′UTR, rescued by Mir505–3p inhibitors. (F) ATG12 was regulated by Mir505–3p in cultured cortical neurons. Immunoblottings were performed using ATG12 and GAPDH antibodies of 3DIV neurons transfected by AMAXA nucleofector with vectors as indicated. (G) Measurements of immunoblotting in (F). At least 3 independent assays were measured. Error bars: SEM. *P < 0.05, ** P < 0.01, *** P < 0.001 (Student t test).
Figure 5.
Figure 5.
ATG12 is a negative regulator of axonal development. (A) Example pictures of mouse primary cortical neurons transfected with AMAXA nucleofector with GFP or constructs indicated. Neurons were fixed and stained for immunofluorescence with SMI312 and GFP antibodies at 3 DIV for measuring axon numbers. Scale bar: 20 μm. (B) Example pictures of mouse primary cortical neurons transfected with Lipofectamine 2000 at 1 DIV with GFP or constructs as indicated. Scale bar: 20 μm. (C) Measurements of axon numbers of each condition in (A). (D) Measurements of neuron polarity of each condition in (B). (E) Measurements of total axon length of each condition in (B). A total 30 to 33 neurons from each condition were randomly selected and measured. Error bars are SEM. *P < 0.05, **P < 0.01, *** P < 0.001 (t test). (F) Images of coronal brain sections of P8 mice electroporated at E14.5 with plasmids indicated. Scale bar: 1000 μm. (G) Magnification images of ipsilateral brain sections in (F). Scale bar: 100 μm. (H) Magnification images of contralateral brain sections in (F). Scale bar: 100 μm. (I) Measurements of axonal signal intensity in ipsilateral cortical plate layer 5 of each condition in (G). (J) Measurements of axonal signal intensity in the contralateral cortical plate from layer 1 to white matter of each condition in (H). At least 4 litters for each condition were measured. Error bars are SEM. *** P < 0.001 (Student t test).
Figure 6.
Figure 6.
Genetic deletion of Mir505–3p activates autophagy in the brain. (A) Example pictures and enlarged pictures of cortical neurons of each genotype. (B) Example pictures and enlarged pictures of cortices of each genotype. Pseudo colors were applied to represent individual autophagosome (green circle, indicated by green capital letter “A” with white arrow) and mitochondria (blue circle, indicated by blue capital letter “M” with black arrow). (C and D) Measurements of autophagosome sizes in the unit area of cytoplasm in cortical neurons and cortex, respectively. (E and F) Measurements of autophagosome numbers in the unit area of cytoplasm in cortical neurons and cortex, respectively. (G and H) Measurements of mitochondria numbers in the unit area of cytoplasm in cortical neurons and cortex, respectively. At least 4 litters were measured for each condition. (I) Increase of ATG12, LC3B-II/-I and decrease of SQSTM1/p62 in mir505 KO mice. Immunoblotting was performed with the antibodies as indicated. (J to L) Measurements of protein levels of ATG12, SQSTM1/p62 and LC3B-II/-I in (I). Error bars are SEM. **P < 0.01, *** P < 0.001 (Student t test).
Figure 7.
Figure 7.
Mir505–3p regulates autophagy by targeting Atg12. (A) Example pictures and enlarged pictures of MEF cells from TEM strategy. Cells were transfected with constructs as indicated. Two d after transfection, MEF cells were fed with various treatments as indicated, for 3 h followed by fixing with 2.5% glutaraldehyde in PBS. Pseudo colors were applied to represent individual autophagosomes (green circle, indicated by green capital letter “A” with white arrow) and mitochondria (blue circle, indicated by blue capital letter “M” with black arrow). (B) Measurements of autophagosome sizes in the unit area of cytoplasm in each condition, respectively. (C and D) Measurements of autophagosome number and mitochondria numbers in the unit area of cytoplasm in each condition, respectively. Error bars are SEM. *P < 0.05, **P < 0.01, *** P < 0.001 (Student t test).
Figure 8.
Figure 8.
Mir505–3p influences mitochondria numbers by inhibiting ATG12 and the autophagy pathway. (A to C) Immunoblotting was performed in the expression of the Atg12 ORF, RPMC induction and CQ induction conditions with antibodies as indicated. (D to G) Measurements of protein levels of ATG12, SQSTM1/p62, LC3B-II/-I and MFN2 in (A, B, C). (H) Schematic diagram of hypothetical regulatory mechanisms of the Mir505–3p-ATG12 axonal development pathway. Autophagosome formation consists of 3 main steps: nucleation, expansion and maturation. ATG12 participates in the ATG12–ATG5-ATG16L1 complex which is required for autophagosome scaffold construction. In a developing axon, downregulation of ATG12 by Mir505–3p results in decrease of the autophagy signal, which leads to an abundant storage of the local axonal positive regulatory component and a greater supply of energy generated from mitochondria. Thus, the axonal specification, extension and branching are promoted.

Similar articles

Cited by

References

    1. Levine B, Kroemer G. Autophagy in the pathogenesis of disease. Cell. 2008;132:27-42. https://doi.org/10.1016/j.cell.2007.12.018. PMID:18191218 - DOI - PMC - PubMed
    1. Zoghbi HY, Bear MF. Synaptic dysfunction in neurodevelopmental disorders associated with autism and intellectual disabilities. Cold Spring Harb Perspect Biol. 2012;4, pii: a009886. https://doi.org/10.1101/cshperspect.a009886. PMID:22258914. - DOI - PMC - PubMed
    1. Komatsu M, Waguri S, Chiba T, Murata S, Iwata J, Tanida I, Ueno T, Koike M, Uchiyama Y, Kominami E, et al.. Loss of autophagy in the central nervous system causes neurodegeneration in mice. Nature. 2006;441:880-4. https://doi.org/10.1038/nature04723. PMID:16625205 - DOI - PubMed
    1. Hara T, Nakamura K, Matsui M, Yamamoto A, Nakahara Y, Suzuki-Migishima R, Yokoyama M, Mishima K, Saito I, Okano H, et al.. Suppression of basal autophagy in neural cells causes neurodegenerative disease in mice. Nature. 2006;441:885-9. https://doi.org/10.1038/nature04724. PMID:16625204 - DOI - PubMed
    1. Komatsu M, Waguri S, Koike M, Sou Y, Ueno T, Hara T, Mizushima N, Iwata J, Ezaki J, Murata S, et al.. Homeostatic levels of p62 control cytoplasmic inclusion body formation in autophagy-deficient mice. Cell. 2007;131:1149-63. https://doi.org/10.1016/j.cell.2007.10.035. PMID:18083104 - DOI - PubMed

LinkOut - more resources