. 2017 Oct 5:2:28.
doi: 10.12688/wellcomeopenres.11300.3. eCollection 2017.

Capturing the systemic immune signature of a norovirus infection: an n-of-1 case study within a clinical trial

Affiliations

Capturing the systemic immune signature of a norovirus infection: an n-of-1 case study within a clinical trial

Antony J Cutler et al. Wellcome Open Res. .

Abstract

Background: The infection of a participant with norovirus during the adaptive study of interleukin-2 dose on regulatory T cells in type 1 diabetes (DILT1D) allowed a detailed insight into the cellular and cytokine immune responses to this prevalent gastrointestinal pathogen.

Methods: Serial blood, serum and peripheral blood mononuclear cell (PBMC) samples were collected pre-, and post-development of the infection. To differentiate between the immune response to norovirus and to control for the administration of a single dose of aldesleukin (recombinant interleukin-2, rIL-2) alone, samples from five non-infected participants administered similar doses were analysed in parallel.

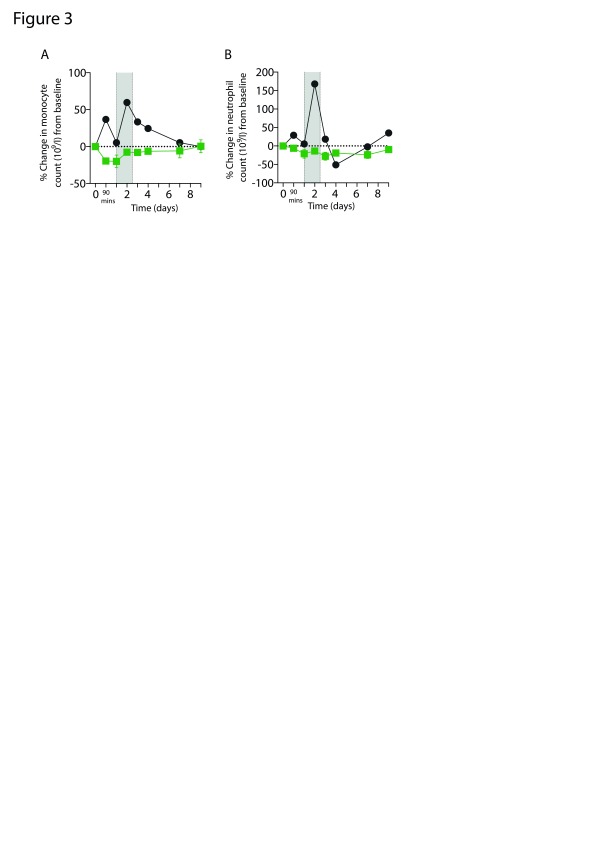
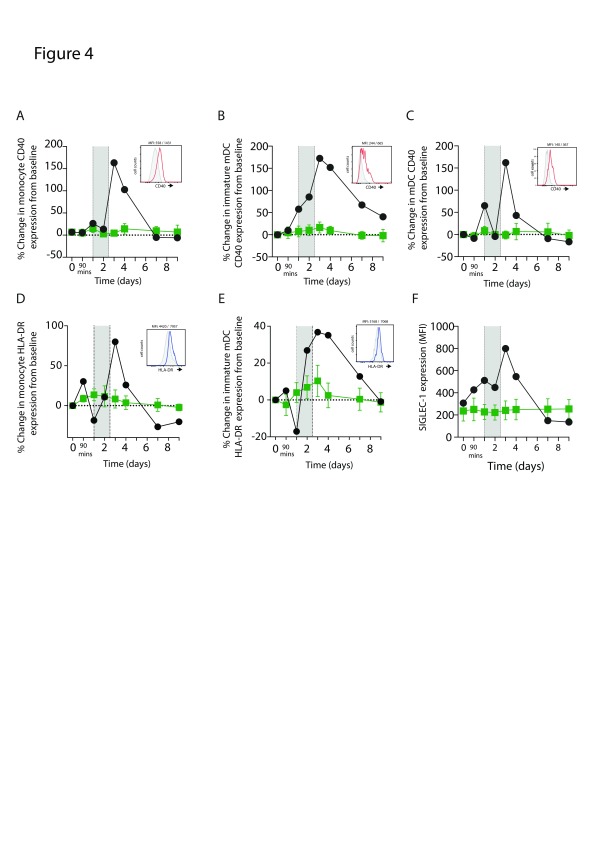
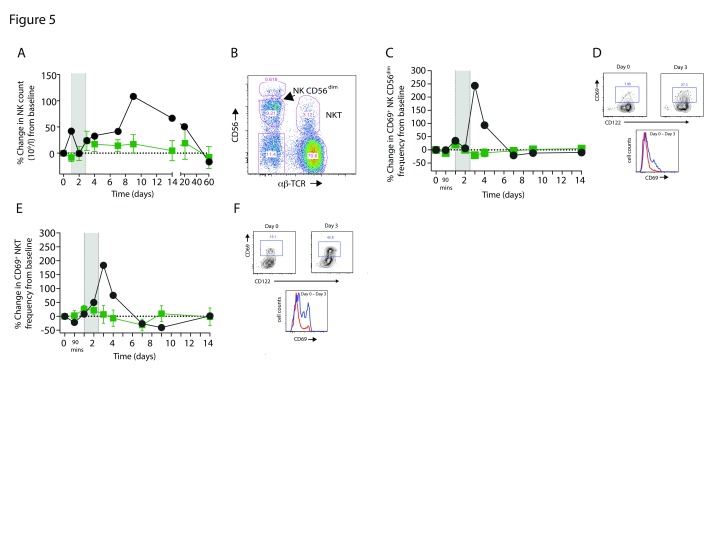
Results: Norovirus infection was self-limited and resolved within 24 hours, with the subsequent development of anti-norovirus antibodies. Serum pro- and anti-inflammatory cytokine levels, including IL-10, peaked during the symptomatic period of infection, coincident with increased frequencies of monocytes and neutrophils. At the same time, the frequency of regulatory CD4 + T cell (Treg), effector T cell (Teff) CD4 + and CD8 + subsets were dynamically reduced, rebounding to baseline levels or above at the next sampling point 24 hours later. NK cells and NKT cells transiently increased CD69 expression and classical monocytes expressed increased levels of CD40, HLA-DR and SIGLEC-1, biomarkers of an interferon response. We also observed activation and mobilisation of Teffs, where increased frequencies of CD69 + and Ki-67 + effector memory Teffs were followed by the emergence of memory CD8 + Teff expressing the mucosal tissue homing markers CD103 and β7 integrin. Treg responses were coincident with the innate cell, Teff and cytokine response. Key Treg molecules FOXP3, CTLA-4, and CD25 were upregulated following infection, alongside an increase in frequency of Tregs with the capacity to home to tissues.

Conclusions: The results illustrate the innate, adaptive and counter-regulatory immune responses to norovirus infection. Low-dose IL-2 administration induces many of the Treg responses observed during infection.

Keywords: Interleukin-2; Proleukin; T regulatory cells; aldesleukin; clinical trial; immune response; norovirus.


Conflict of interest statement

Competing interests: FWL has received fees for consulting and speaking on type 1 diabetes and immunotherapeutics from GlaxoSmithKline, Novo Nordisk, Eli Lilly, Epidarex Capital and Hoffmann-La Roche. LSW has received funds to support research from Hoffmann-La Roche and has received consultancy fees from Kymab Access Limited. JAT has received ad hoc consultancy fees from GlaxoSmithKline, AstraZeneca, Pfizer, Janssen and Kymab Limited and is Director of the JDRF/Wellcome Trust Diabetes and Inflammation Laboratory that has received research grant funds from F Hoffmann-La Roche and Eli Lilly.

Figures

Figure 1.
Figure 1.. Specific increase in anti-norovirus GII.4 antibodies in the trial participant with gastrointestinal symptoms.
( A) Anti-norovirus GII.4 Dijon virus-like particles (VLP) serum antibody titres at day 0 (red filled circles), day 14 (filled black squares) and day 60 (filled blue circles) post-IL-2 dosing in six participants (5 dose-matched uninfected participants) and a participant with gastrointestinal symptoms receiving 0.408 – 0.445 × 10 6 IU IL-2/m 2. ( B) Anti-vesivirus and hepatitis E virus (HEV) titres were assessed pre-IL-2 (filled red circle +/- SD) and day 60 post-IL-2 administration (filled blue circle +/- SD) in the infected participant.
Figure 2.
Figure 2.. Norovirus infection induces proinflammatory cytokine and sSIGLEC-1 release.
( A) IL-2 levels (IU/ml) (black circles), ( B) IL-12p70 levels (pg/ml) (orange circles), ( C) the percentage change in TNF-α levels from baseline (red circles), ( D) IL-6 (violet circles), ( E) IL-10 (blue circles), ( F) IFN-γ (pink circles), ( G) IP-10 (purple circles), ( H) CRP (brown circles) and ( I) soluble SIGLEC-1 levels (grey circles) were measured in the norovirus-infected participant versus uninfected participants (green squares +/- SEM). Analytes were measured in serum or plasma. ( BH) Data were normalised to and expressed as percentage change from baseline (day 0). The shaded area indicates the period of reported gastroenteritis.
Figure 3.
Figure 3.. Neutrophils and monocytes are rapidly mobilised during norovirus infection.
Percentage change from baseline in ( A) monocyte and ( B) neutrophil counts was determined in uninfected participants (filled green squares +/- SEM) and the norovirus-infected participant (filled black circles). Data were normalised to and expressed as percentage change from day 0 levels. The shaded area indicates the period of reported gastroenteritis.
Figure 4.
Figure 4.. Antigen presenting cells upregulate expression of costimulatory molecules and an interferon signature biomarker.
Percentage change in CD40 expression (mean fluorescent intensity, [MFI]) from baseline was determined on ( A) monocytes (CD14 ++), ( B) immature myeloid DC (CD11c + CD1c lin CD123 intCD304 ) or ( C) myeloid dendritic cells (CD1c +lin CD123 CD304 ) from uninfected participants (filled squares +/- SEM) or the norovirus-infected participant (filled circles). Data were normalised to and expressed as percentage change from day 0 levels. The shaded area indicates the period of reported gastroenteritis. Inset histograms show CD40 expression at pre-dosing (filled grey) or day 3 (red line) in the norovirus-infected participant for each cell subset. ( D) Percentage change in HLA-DR expression (MFI) from baseline on monocytes and ( E) immature myeloid DCs from uninfected participants (filled squares +/- SEM) or the norovirus-infected participant (filled circles). Inset histograms show HLA-DR expression for each cell type at day 3 (blue line) post-IL-2 injection compared to pre-dosing levels (filled grey) in the norovirus-infected participant. ( F) SIGLEC-1 expression (MFI) was determined on peripheral blood monocytes (CD14 ++CD16 lo) in uninfected participants (filled green squares) versus the norovirus-infected participant (filled black circles). The shaded area indicates the period of reported gastroenteritis. All analyses were performed using cryopreserved PBMCs.
Figure 5.
Figure 5.. Norovirus infection induces an increase in the frequency of CD69 + NK and NKT cells.
The percentage change in frequency from baseline of total NK cells was measured using multitest TBNK tubes ( A). Deeper analysis of blood NK, NKT and non-NK subsets was carried out using the gating strategy shown in ( B). The percentage change in frequency from baseline of CD69 + CD56 dim NK cells ( C) and CD69 + NKT cells ( E) was measured in uninfected participants (filled green squares +/- SEM) and the norovirus-infected participant (filled black circles). Data were normalised to and expressed as percentage change from baseline (day 0). Expression of CD69 and CD122 by αβ TCR CD56 dim NK cells ( D) and αβ +TCR + CD56 + NKT cells ( F) is shown in contour plots in the norovirus-infected participant at the indicated timepoints post-IL-2 administration. Histograms show the differential expression of CD69 on αβ TCR CD56 dim NK cells ( D) and αβ +TCR + CD56 + NKT cells ( F) at the peak of the response (day 3, blue line) versus day 0 (red line) in the norovirus-infected participant.
Figure 6.
Figure 6.. Dynamic effector memory CD4 + T cell responses to norovirus infection.
The percentage change in frequency of CD4 + cmTeffs ( A), CD4 + emTeffs ( B) of total CD4 + T cells from baseline levels. The percentage change in frequency of CD69 + CD4 + cmTeffs ( C), CD69 + CD4 + emTeffs ( D), Ki-67 + CD4 + cmTeffs ( E) and Ki-67 + CD4 + emTeffs ( F) relative to their respective baseline levels in uninfected participants (filled green square+/-SEM) and the norovirus-infected participant (filled black circles). The shaded area indicates the period of reported gastroenteritis. Contour plots showing expression of CD69 and CD25 ( D) and Ki-67 and CD25 ( F) on CD4 + emTeffs pre-IL-2 administration (day 0) and at the peak of the response in the norovirus-infected participant (day 2 or 7 respectively).
Figure 7.
Figure 7.. Temporal changes in frequency and CD69 expression in memory CD8 + T cell subsets immediately following norovirus infection.
The percentage change in frequency of CD8 + cmTeffs ( A), CD8 + emTeffs ( B) of total CD8 + T cells from baseline levels. The percentage change in frequency of CD69 + CD8 + cmTeffs ( C) CD69 + emTeffs ( E) relative to baseline levels in uninfected participants (filled green square+/-SEM) and the norovirus-infected participant (filled black circles). The shaded area indicates the period of reported gastroenteritis. Contour plots showing expression of CD69 in the CD8 + cmTeff ( D) and CD8 + emTeff ( F) populations, pre-IL-2 administration (day 0) and at the peak of the response in the norovirus-infected participant (day 3). Histograms show the differential expression of CD69 on cmCD8 + T cells ( D) and emCD8 + T cells ( F) at the peak of the response (day 3, blue line) versus day 0 (red line) in the norovirus-infected participant.
Figure 8.
Figure 8.. The emergence of memory CD8 + Teffs in cell cycle and with mucosal homing capacity post-norovirus infection.
The percentage change in frequency of Ki-67 + CD8 + cmTeffs ( A) and Ki-67 + CD8 + emTeffs ( B). Contour plots for each cell subset show Ki-67 and CD25 expression pre-IL-2 administration and at the peak of the response in the norovirus-infected participant. Timecourse analysis of the frequency of CD103 +CD45RA CD27 CD8 + emTeffs of total CD8 + T cells ( C). Contour plots showing the frequency of CD103 +β7integrin −/loCD45RA CD27 CD8 + emTeffs at day 0 and day 7 post-IL-2 ( D). ( E) The change in frequency of CD103 +β7integrin +CD45RA CD27 + CD8 + cmTeffs of total CD8 + T cells relative to baseline levels. ( F) Contour plots showing the frequency of CD103 +β7 integrin +CD45RA CD27 + CD8 + cmTeffs at day 0 and day 7 post-IL-2. ( A, B, C and E) data were normalised to and expressed as percentage change from baseline (day 0) in uninfected participants (filled squares +/- SEM) or the norovirus-infected participant (filled circles). Analyses were performed using cryopreserved PBMCs. The shaded area indicates the period of reported gastroenteritis.
Figure 9.
Figure 9.. A counter-regulatory response to norovirus infection is coincident with effector cell mobilisation.
The percentage change in frequency of mTregs ( A), CXCR3 + mTregs ( B) and CCR6 + mTregs ( C) of total CD4 + T cells in the norovirus-infected and uninfected participants. Phosphorylation of STAT5a (MFI) in mTregs in the norovirus-infected participant and controls (filled squares +/- SD) ( D). The percentage change in CD25 ( E), FOXP3 ( F) and CTLA-4 ( G) expression (MFI) relative to baseline on mTregs in controls or the norovirus-infected participant. Data were normalised to and expressed as percentage change from baseline (day 0) and measured in uninfected participants (filled green squares +/-SEM, n=5 apart from 9B and 9C where n=3) and the norovirus-infected (filled black circles) participant. The shaded area indicates the period of reported gastroenteritis. Histograms show the differential expression of CD25 ( E), Foxp3 ( F) and CTLA-4 ( G) at the peak of the response (day 3: CD25, FOXP3 and day 2: CTLA-4, blue line) versus day 0 pre-IL-2 (red line) and the shaded grey histogram is expression of CD25, CTLA-4 and FOXP3 in naïve CD4 + Teffs at day 0 in the norovirus-infected participant, as a negative control for staining.

Similar articles

Cited by

References

    1. Todd JA, Evangelou M, Cutler AJ, et al. : Regulatory T Cell Responses in Participants with Type 1 Diabetes after a Single Dose of Interleukin-2: A Non-Randomised, Open Label, Adaptive Dose-Finding Trial. PLoS Med. 2016;13(10):e1002139. 10.1371/journal.pmed.1002139 - DOI - PMC - PubMed
    1. Waldron-Lynch F, Kareclas P, Irons K, et al. : Rationale and study design of the Adaptive study of IL-2 dose on regulatory T cells in type 1 diabetes (DILT1D): a non-randomised, open label, adaptive dose finding trial. BMJ Open. 2014;4(6):e005559. 10.1136/bmjopen-2014-005559 - DOI - PMC - PubMed
    1. Lopman BA, Steele D, Kirkwood CD, et al. : The Vast and Varied Global Burden of Norovirus: Prospects for Prevention and Control. PLoS Med. 2016;13(4):e1001999. 10.1371/journal.pmed.1001999 - DOI - PMC - PubMed
    1. Newman KL, Marsh Z, Kirby AE, et al. : Immunocompetent adults from human norovirus challenge studies do not exhibit norovirus viremia. J Virol. 2015;89(13):6968–6969. 10.1128/JVI.00392-15 - DOI - PMC - PubMed
    1. Karst SM, Wobus CE, Goodfellow IG, et al. : Advances in norovirus biology. Cell Host Microbe. 2014;15(6):668–680. 10.1016/j.chom.2014.05.015 - DOI - PMC - PubMed