A practical validation study of a commercial accelerometer using good and poor sleepers
- PMID: 28815052
- PMCID: PMC5221738
- DOI: 10.1177/2055102916679012
A practical validation study of a commercial accelerometer using good and poor sleepers
Abstract
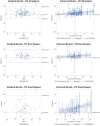
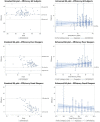
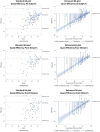
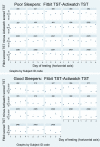
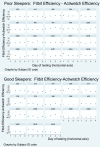
We validated a Fitbit sleep tracking device against typical research-use actigraphy across four nights on 38 young adults. Fitbit devices overestimated sleep and were less sensitive to differences compared to the Actiwatch, but nevertheless captured 88 (poor sleepers) to 98 percent (good sleepers) of Actiwatch estimated sleep time changes. Bland-Altman analysis shows that the average difference between device measurements can be sizable. We therefore do not recommend the Fitbit device when accurate point estimates are important. However, when qualitative impacts are of interest (e.g. the effect of an intervention), then the Fitbit device should at least correctly identify the effect's sign.
Keywords: Fitbit; actigraphy; longitudinal studies; sleep; validation studies.
Conflict of interest statement
Declaration of conflicting interests: The author(s) declared no potential conflicts of interest with respect to the research, authorship, and/or publication of this article.
Figures


Similar articles
-
The Development and Accuracy of the THIM Wearable Device for Estimating Sleep and Wakefulness.Nat Sci Sleep. 2021 Jan 12;13:39-53. doi: 10.2147/NSS.S287048. eCollection 2021. Nat Sci Sleep. 2021. PMID: 33469399 Free PMC article.
-
Comparison of a Commercial Accelerometer with Polysomnography and Actigraphy in Children and Adolescents.Sleep. 2015 Aug 1;38(8):1323-30. doi: 10.5665/sleep.4918. Sleep. 2015. PMID: 26118555 Free PMC article. Clinical Trial.
-
Field-based Measurement of Sleep: Agreement between Six Commercial Activity Monitors and a Validated Accelerometer.Behav Sleep Med. 2020 Sep-Oct;18(5):637-652. doi: 10.1080/15402002.2019.1651316. Epub 2019 Aug 27. Behav Sleep Med. 2020. PMID: 31455144 Free PMC article.
-
Systematic review of the validity and reliability of consumer-wearable activity trackers.Int J Behav Nutr Phys Act. 2015 Dec 18;12:159. doi: 10.1186/s12966-015-0314-1. Int J Behav Nutr Phys Act. 2015. PMID: 26684758 Free PMC article. Review.
-
Accuracy of Fitbit Devices: Systematic Review and Narrative Syntheses of Quantitative Data.JMIR Mhealth Uhealth. 2018 Aug 9;6(8):e10527. doi: 10.2196/10527. JMIR Mhealth Uhealth. 2018. PMID: 30093371 Free PMC article. Review.
Cited by
-
Sleep Patterns, Pain, and Emotional Functioning in Youth with Inflammatory Bowel Disease.Clin Pract Pediatr Psychol. 2024 Mar;12(1):82-92. doi: 10.1037/cpp0000491. Epub 2023 Aug 24. Clin Pract Pediatr Psychol. 2024. PMID: 38766379
-
Effects of mental contrasting on sleep and associations with stress: A randomized controlled trial.J Health Psychol. 2023 Sep;28(11):1057-1071. doi: 10.1177/13591053231159168. Epub 2023 Mar 15. J Health Psychol. 2023. PMID: 36922707 Free PMC article. Clinical Trial.
-
The effect of air quality on sleep and cognitive performance in school children aged 10-12 years: a double-blinded, placebo-controlled, crossover trial.Int J Occup Med Environ Health. 2023 May 23;36(2):177-191. doi: 10.13075/ijomeh.1896.02032. Epub 2023 Feb 16. Int J Occup Med Environ Health. 2023. PMID: 36861764 Free PMC article. Clinical Trial.
-
Quality Evaluation of Free-living Validation Studies for the Assessment of 24-Hour Physical Behavior in Adults via Wearables: Systematic Review.JMIR Mhealth Uhealth. 2022 Jun 9;10(6):e36377. doi: 10.2196/36377. JMIR Mhealth Uhealth. 2022. PMID: 35679106 Free PMC article. Review.
-
Improving Sleep Among Teachers: an Implementation-Intention Intervention.Int J Behav Med. 2023 Feb;30(1):49-61. doi: 10.1007/s12529-022-10069-7. Epub 2022 Mar 1. Int J Behav Med. 2023. PMID: 35233749 Free PMC article.
References
-
- Bland MJ, Altman DG. (1986) Statistical methods for assessing agreement between two methods of clinical measurement. The Lancet 327(8476): 307–310. - PubMed
-
- Buysse DJ, Reynolds CF, III, Monk TH, et al. (1989) The Pittsburgh Sleep Quality Index: A new instrument for psychiatric practice and research. Psychiatry Research 28(2): 193–213. - PubMed
LinkOut - more resources
Full Text Sources
Other Literature Sources

