. 2017 Oct 2;216(10):3179-3198.
doi: 10.1083/jcb.201701024. Epub 2017 Aug 16.

EB1 and EB3 regulate microtubule minus end organization and Golgi morphology

Affiliations

EB1 and EB3 regulate microtubule minus end organization and Golgi morphology

Chao Yang et al. J Cell Biol. .

Abstract

End-binding proteins (EBs) are the core components of microtubule plus end tracking protein complexes, but it is currently unknown whether they are essential for mammalian microtubule organization. Here, by using CRISPR/Cas9-mediated knockout technology, we generated stable cell lines lacking EB2 and EB3 and the C-terminal partner-binding half of EB1. These cell lines show only mild defects in cell division and microtubule polymerization. However, the length of CAMSAP2-decorated stretches at noncentrosomal microtubule minus ends in these cells is reduced, microtubules are detached from Golgi membranes, and the Golgi complex is more compact. Coorganization of microtubules and Golgi membranes depends on the EB1/EB3-myomegalin complex, which acts as membrane-microtubule tether and counteracts tight clustering of individual Golgi stacks. Disruption of EB1 and EB3 also perturbs cell migration, polarity, and the distribution of focal adhesions. EB1 and EB3 thus affect multiple interphase processes and have a major impact on microtubule minus end organization.


Figures

Figure 1.
Figure 1.
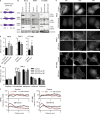
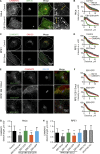
Characterization of cell lines with disrupted EB-encoding genes. (A) Schemes of EB1, EB2, and EB3 proteins and the position of gRNA sequences. Arrow indicates the in-frame Met at the beginning of the EB2 CH domain. (B and C) Western blot analysis and immunostaining of control and the EB mutant cells with the indicated antibodies. (D and E) Quantification of the mitotic index and mitotic stages in the indicated cell lines. (D) n ≥ 3 and (E) n = 4 experiments, with 3,000 cells each. (F) Mean intensity of EB2 and α-tubulin staining starting from the MT tip (0); 26–28 MT ends analyzed per condition from 6–10 cells. *, P < 0.05; **, P < 0.01 (Mann-Whitney U test).
Figure 2.
Figure 2.
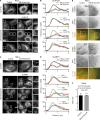
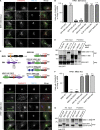
Effect of EB disruption on +TIP localization. (A and C) Immunostaining for CLIP170 and CLASP1 in control and EB1/2/3mut HeLa cells expressing the indicated constructs. Enlargements of the boxed areas indicated by numbers are shown on the right. In C, cells were incubated with the GSK3 inhibitor SB415286 (20 µM) for 30 min before fixation. (B and D) Averaged intensities of staining for the indicated +TIP obtained for 20–24 MT ends per condition. MT end position (0) was determined by staining for β-tubulin. (E and F) Live images of the indicated cell lines transfected with ch-TOG-GFP together with mKate-α-tubulin (larger and smaller fields of view shown; E) and quantification of ch-TOG signal-to-noise ratio at MT tips (F). n = 30 cells in three independent experiments. Mann-Whitney U test.
Figure 3.
Figure 3.
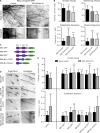
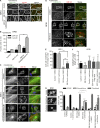
Effect of EB disruption on MT dynamics. (A) Single frames and kymographs of MT dynamics in the indicated cell lines transiently transfected with β-tubulin–GFP. (B) Parameters of MT dynamics in the indicated cell lines. 74–240 MT plus ends were analyzed per condition. (C and D) Scheme of the used EB constructs (C) and single frames and kymographs illustrating MT plus end dynamics visualized with the indicated constructs (D). (E) Plots of MT growth velocity and catastrophe frequency. 158–264 MT plus ends were analyzed per condition. ***, P < 0.001 (Mann-Whitney U test).
Figure 4.
Figure 4.
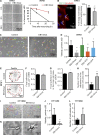
Effect of EB disruption on MT and Golgi organization. (A–D) Immunostaining for α-tubulin and GM130 in the indicated cell lines; in C and D, cells were transfected with the indicated EB–GFP fusions. Boxes in A show examples of areas used for quantification in E. (E–G) Quantification of the ratio of MT intensity in the cell center and cell periphery (boxes in A; E) or the Golgi area in the indicated cell lines, transfected with the indicated constructs. n = 24–41 cells per condition (E), 31–66 cells (F), and 28–47 cells (G). (H and I) EM images of the Golgi area (Golgi stacks indicated with a G; H) and quantification of the total area occupied by in Golgi stacks (I). n = 3 experiments with 50 cells each. ***, P < 0.001 (Mann-Whitney U test).
Figure 5.
Figure 5.
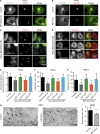
Distribution of CAMSAP2-decorated MT minus ends in cells with mutated EBs. (A and C) Immunostaining for CAMSAP2 and GM130 in the indicated cells. Enlargements on the right in A show cell periphery; yellow arrows indicate the 3-µm-broad region used for quantification in Fig. S3 G. (B, D, and F) Averaged intensity distributions for GM130 and CAMSAP2 in the indicated cell lines, either untransfected or transfected with the indicated constructs. Distance from the center of the Golgi is shown on the horizontal axis and normalized fluorescence intensity on the vertical axis. n = 23–43 cells per condition. (E) Immunostaining for CAMSAP2 and GM130 in EB1/3mut RPE1 cells expressing the indicated constructs. (G and H). Quantification of CAMSAP2 stretch length. 1000 stretches in 10 cells were measured per condition, except for MMG and AKAP450 knockout cells (H), for which 200 stretches in 8 and 10 cells were measured. ***, P < 0.001 (Mann-Whitney U test).
Figure 6.
Figure 6.
EB interaction with MMG is required to recruit CAMSAP2 stretches to the Golgi. (A and D) Immunostaining for CAMSAP2 and GM130 of EB1/3mut (A) or MMG knockout (D) RPE1 cells expressing the indicated constructs. (B and F) Percentage of cells with CAMSAP2 stretches in the Golgi area in EB1/3mut (B) or MMG knockout (F) RPE1 cells expressing the indicated constructs. n = 77–112 transfected cells in B and 41–81 transfected cells in F. **, P < 0.01; ***, P < 0.001 (Student’s t test). (C) A scheme of MMG–EB3 interaction and the fusion constructs used. (E and G) Streptavidin pull-down assays with the extracts of HEK293T cells coexpressing the indicated biotinylation tag (Bio)-GFP–MMG fusions, the indicated EB–GFP fusions, and biotin ligase BirA, analyzed by Western blotting with anti-GFP antibodies.
Figure 7.
Figure 7.
Effect of EB1, EB3, and CAMSAP2 disruption on Golgi organization and MT nucleation from Golgi. (A) Western blots of the extracts of EB1/3/CAMSAP2mut RPE1 cells. (B and C) Immunostaining for α-tubulin and GM130 (B) or γ-tubulin (C) in EB1/3/CAMSAP2mut RPE1 cells. In C, enlarged images of the boxed areas are shown below. (D and E) Immunostaining for GM130 and quantification of the Golgi area in the indicated cell lines. n = 50 cells per condition. (F) Immunostaining of GM130 and α-tubulin in the indicated cell lines after a 3-min recovery from nocodazole treatment. (G) Tubulin intensity in the vicinity of Golgi membranes in the indicated cell lines treated as in F. n = 30 cells per condition. n.s., no significant differences; **, P < 0.01; ***, P < 0.001 (Mann-Whitney U test).
Figure 8.
Figure 8.
Effect of EB1, EB3, and CAMSAP2 disruption on MT and Golgi organization after centriole depletion. (A and B) Immunostaining for CEP135 and γ-tubulin (A) and percentage of γ-tubulin– and CEP135-positive cells in the indicated cell lines after 11 d of treatment with 125 nM centrinone (B). n = 366–391 cells per condition. *, P < 0.05; **, P < 0.01; ***, P < 0.001 (Student’s t test). (C and D) Immunostaining for α-tubulin (C) or CAMSAP2 (D) and GM130 in the indicated cell lines treated with centrinone. Enlarged portions of the boxed areas are shown at the bottom. (E and F) Percentage of cells with CAMSAP2 stretches at the Golgi (E) and quantification of the CAMSAP2 stretch length (F) for the indicated cell lines and treatments. n = 248–418 cells per condition in E and 199–260 CAMSAPP2 stretches in F. **, P < 0.01; ***, P < 0.001 (Mann-Whitney U test). (G) Quantification of Golgi morphology for the indicated PRE1 cell lines and treatments. Three types of Golgi organization are shown on the left. 335–642 control and 153–593 centrinone-treated cells were analyzed. Significant differences between values are indicated: *, control (DMSO) treatment; #, centrinone treatment. * or #, P < 0.05; ** or ##, P < 0.01 (Mann-Whitney U test).
Figure 9.
Figure 9.
Effects of EB1 and EB3 disruption on cell migration. (A) Phase-contrast images of monolayer wound-healing assays in control and EB1/3mut RPE1 cells at the indicated time points and percentage of wound area closure. n = 3 independent experiments. (B) Immunostaining for α-tubulin and GM130 in a wound healing assay and the quantification of the Golgi reorientation. n = 163 control and 152 EB1/3mut RPE1 cells. (C). Phase contrast images and tracks of control and EB1/3mut cells during 7-h migration in sparse culture (C). (D) Quantification of cell migration velocity in control and EB1/3mut RPE1 cells expressing the indicated constructs. n = 30–60 cells. (E–H) Immunostaining for paxillin in the indicated cell lines (E), quantification of FA size in the whole cell (F), and FA size (G) and number (H) in the inner cell area (with 5-µm-broad cell rim excluded, red dotted lines in E). n = 44 control and 55 EB1/3mut RPE1 cells; per condition, 3,000 and 1,000 FAs were analyzed in the whole cell and the inner cell area, respectively. (I and J) Phase contrast images and tracks of control and EB1/3mut HT1080 cells in 3D matrix during 24-h migration (I) and quantification of their migration velocity (J). n = 24 control and 26 EB1/3mut HT1080 cells. (K and L) Morphology of control and EB1/3mut HT1080 cells in 3D matrix and the mean number of protrusions in these cells. n = 65 control and 63 EB1/3mut HT1080 cells. *, P < 0.05; **, P < 0.01; ***, P < 0.001 (Mann-Whitney U test).
Figure 10.
Figure 10.
Model for EB-dependent Golgi–MT coorganization. MMG associates with Golgi membranes through AKAP450 and GM130 and recruits EB1 and EB3, which bind to MT shafts. CAMSAP2 forms MT minus end-localized stretches, which associate with Golgi membranes by binding to the complex of AKAP450 and MMG. EB1 and EB3 also regulate the length of CAMSAP2-decorated MT stretches, likely by controlling MT end dynamics together with some of their partners such as CLASPs. Association of Golgi membranes with free, CAMSAP2-decorated MT minus ends can promote their clustering through dynein-driven minus end–directed transport. Golgi-associated EB1 and EB3 promote spreading of Golgi ribbons along MTs and counteract their dynein-mediated compaction (double-headed arrows).

Similar articles

Cited by

References

    1. Akhmanova A., and Steinmetz M.O.. 2008. Tracking the ends: a dynamic protein network controls the fate of microtubule tips. Nat. Rev. Mol. Cell Biol. 9:309–322. 10.1038/nrm2369 - DOI - PubMed
    1. Akhmanova A., and Steinmetz M.O.. 2015. Control of microtubule organization and dynamics: two ends in the limelight. Nat. Rev. Mol. Cell Biol. 16:711–726. 10.1038/nrm4084 - DOI - PubMed
    1. Akhmanova A., Hoogenraad C.C., Drabek K., Stepanova T., Dortland B., Verkerk T., Vermeulen W., Burgering B.M., De Zeeuw C.I., Grosveld F., and Galjart N.. 2001. Clasps are CLIP-115 and -170 associating proteins involved in the regional regulation of microtubule dynamics in motile fibroblasts. Cell. 104:923–935. 10.1016/S0092-8674(01)00288-4 - DOI - PubMed
    1. Balczon R., Varden C.E., and Schroer T.A.. 1999. Role for microtubules in centrosome doubling in Chinese hamster ovary cells. Cell Motil. Cytoskeleton. 42:60–72. 10.1002/(SICI)1097-0169(1999)42:1<60::AID-CM6>3.0.CO;2-7 - DOI - PubMed
    1. Ban R., Matsuzaki H., Akashi T., Sakashita G., Taniguchi H., Park S.Y., Tanaka H., Furukawa K., and Urano T.. 2009. Mitotic regulation of the stability of microtubule plus-end tracking protein EB3 by ubiquitin ligase SIAH-1 and Aurora mitotic kinases. J. Biol. Chem. 284:28367–28381. 10.1074/jbc.M109.000273 - DOI - PMC - PubMed

MeSH terms

LinkOut - more resources