. 2017 Aug 14;32(2):253-267.e5.
doi: 10.1016/j.ccell.2017.07.006.

Macrophage Polarization Contributes to Glioblastoma Eradication by Combination Immunovirotherapy and Immune Checkpoint Blockade

Affiliations

Macrophage Polarization Contributes to Glioblastoma Eradication by Combination Immunovirotherapy and Immune Checkpoint Blockade

Dipongkor Saha et al. Cancer Cell. .

Abstract

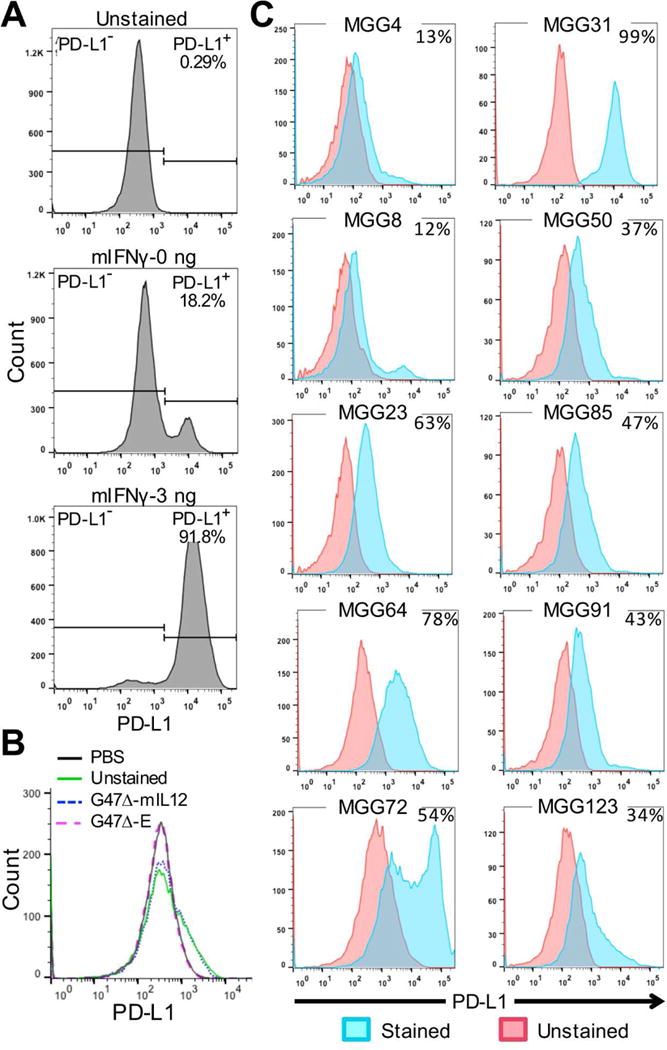
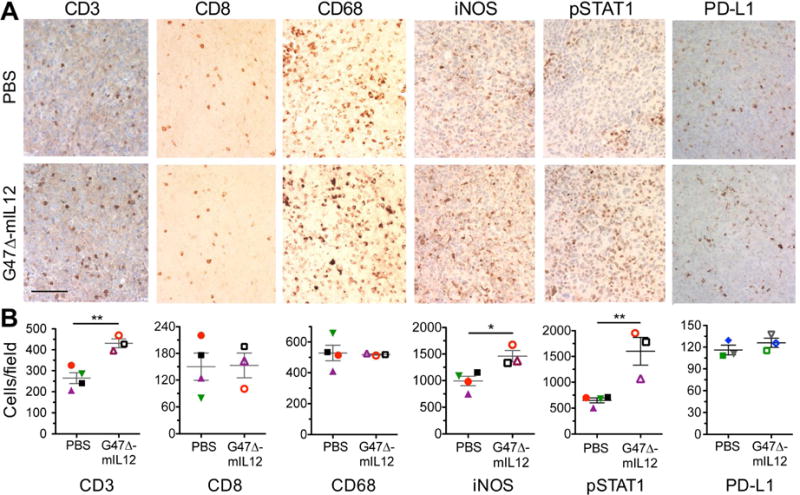
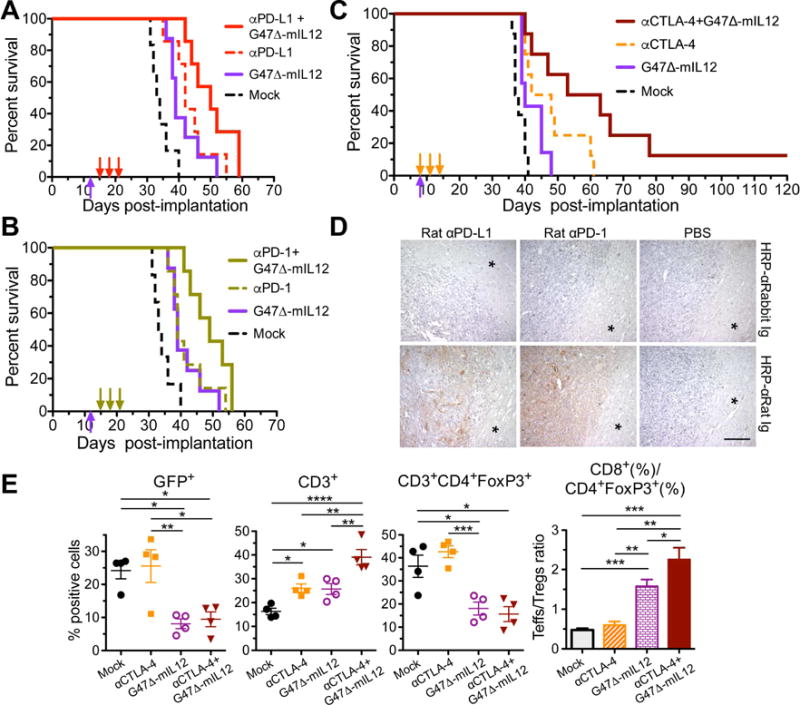
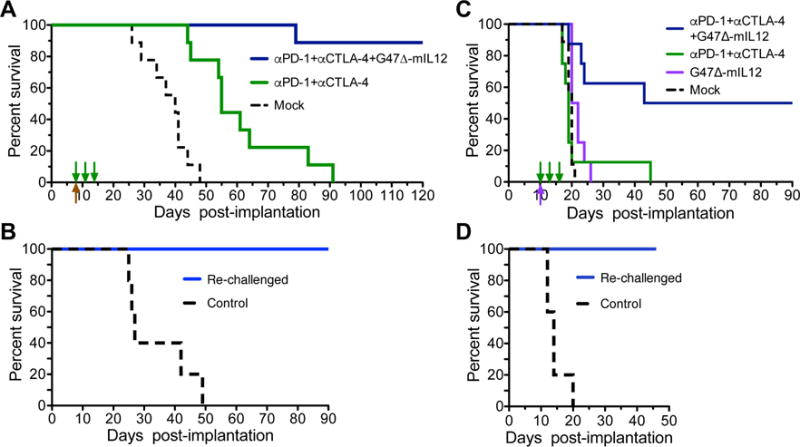
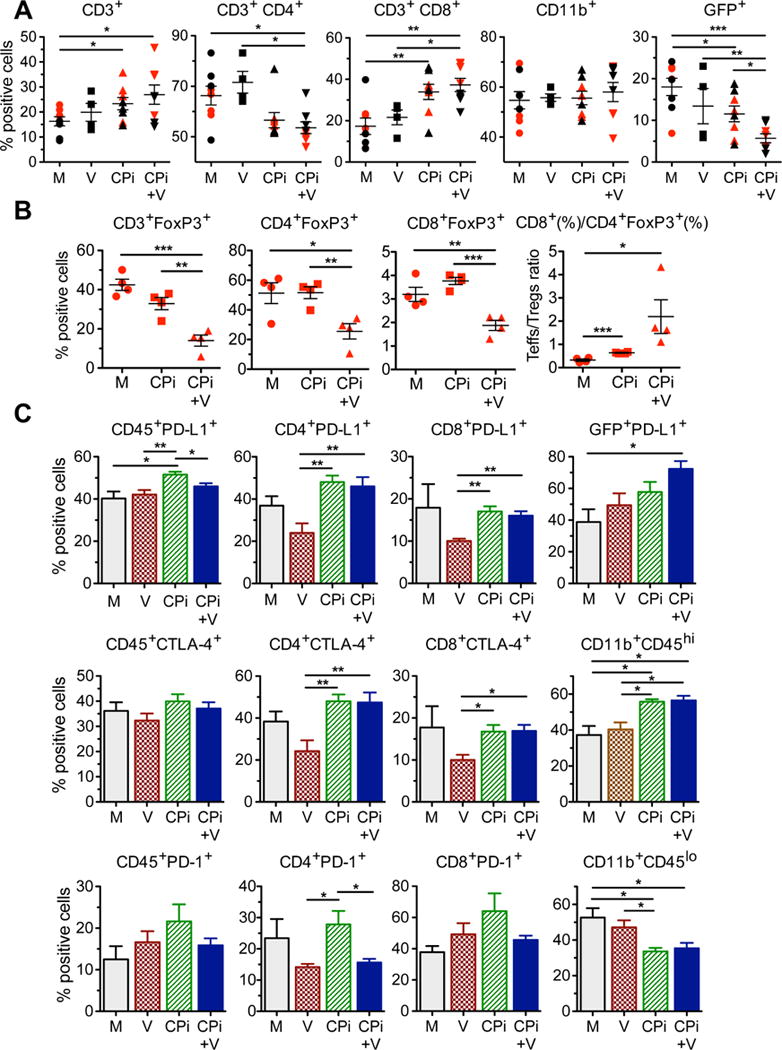
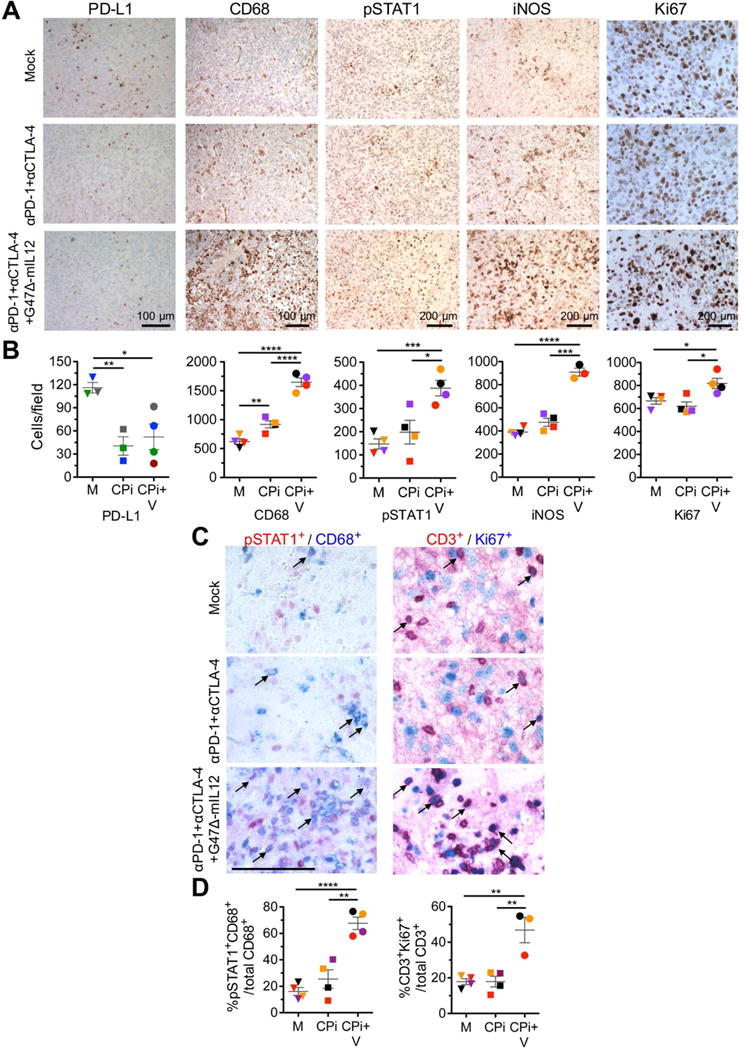
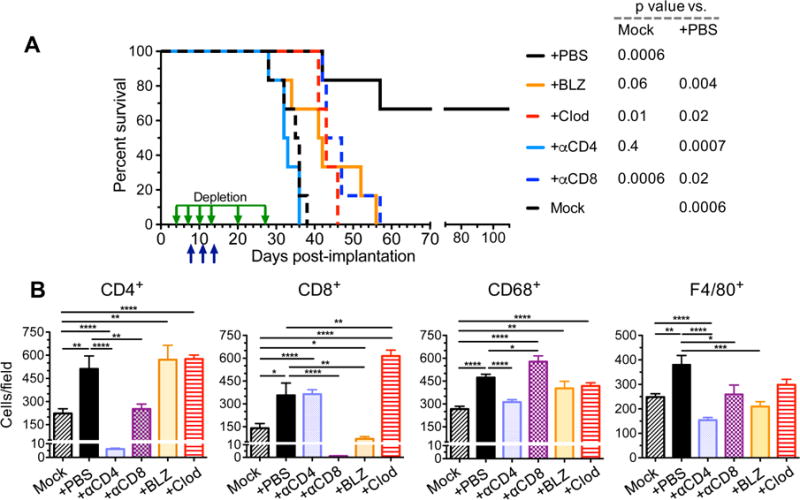
Glioblastoma is an immunosuppressive, fatal brain cancer that contains glioblastoma stem-like cells (GSCs). Oncolytic herpes simplex virus (oHSV) selectively replicates in cancer cells while inducing anti-tumor immunity. oHSV G47Δ expressing murine IL-12 (G47Δ-mIL12), antibodies to immune checkpoints (CTLA-4, PD-1, PD-L1), or dual combinations modestly extended survival of a mouse glioma model. However, the triple combination of anti-CTLA-4, anti-PD-1, and G47Δ-mIL12 cured most mice in two glioma models. This treatment was associated with macrophage influx and M1-like polarization, along with increased T effector to T regulatory cell ratios. Immune cell depletion studies demonstrated that CD4+ and CD8+ T cells as well as macrophages are required for synergistic curative activity. This combination should be translatable to the clinic and other immunosuppressive cancers.

Keywords: HSV; cancer stem cells; glioma; immunotherapy; oncolytic virus.


Figures

Figure 1
Figure 1. Characterization of mouse 005 and human GSCs
A. 005 GSCs cultured for 24 hr with or without murine IFNγ (mIFNγ: 0 or 3 ng/ml), stained for PD-L1, and analyzed by flow cytometry. B. 005 GSCs infected with G47Δ-E or G47Δ-mIL12 at MOI=1 for 24 hr, stained for PD-L1, and analyzed by flow cytometry. C. Human primary (left) and recurrent (right) GSCs cultured for 24 hr, stained for PD-L1 (cyan), and analyzed by flow cytometry. Percent of PD-L1+ cells indicated in upper right. See also Figure S1.
Figure 2
Figure 2. Immunohistochemical staining of immune cell markers after G47
(A–B) Δ-mIL12 treatment. (A–B) 005 GSCs (2 × 10⁴) implanted on day 0, injected intratumorally (IT) with G47Δ-mIL12 (1 × 10⁵ pfu; n=3) or PBS (n=4) on days 18 and 24, animals sacrificed on day 25, and brains collected. Brain tumor sections were stained as indicated. For PD-L1 brain sections, 005 GSCs (2 × 10⁴) implanted on day 0, injected IT with G47Δ-mIL12 (5 × 10⁵ pfu; n=3) or PBS (n=3) on days 17, animals sacrificed on day 24, and brain tumor sections stained with anti-PD-L1 antibody. Representative images are presented; scale bar=100 μm (A). The number of positive cells from 3–9 fields/tumor section (1 section/mouse, except 3 for CD3) were counted (B). Average number of positive cells from each individual mouse is identified by symbol and color. The mean ± SEM of all mice is presented. Data were assessed by Student’s t test; *p<0.05; **p<0.001. See also Figure S1.
Figure 3
Figure 3. Treatment of 005 GSC-derived tumors with systemic immune checkpoint inhibitors, intratumoral G47 Δ-mIL12, or the combination prolongs survival
(A–B) Mice implanted with 2 × 10⁴ 005 GSCs on day 0, treated with G47Δ-mIL12 (5 × 10⁵ pfu) or PBS injected IT on day 12 (upward arrow) and isotype control IgG (10 mg/kg), anti-(α)PD-L1 antibody (A), or anti-(α)PD-1 antibody (B) injected IP on days 15, 18 and 21 (downward arrows). Values from a single experiment, with Mock (treated with PBS and IgG) and G47Δ-mIL12 groups the same in A and B. Median survival of Mock (33.5 days; n=6) was compared to anti-PD-1 (39 days; n=8, p=0.02), anti-PD-L1 (42 days; n=7, p=0.003), or G47Δ-mIL12 (39 days; n=8, p=0.01) by Log-rank analysis. Similarly, G47Δ-mIL12 was compared to the combination of G47Δ-mIL12 with anti-PD-1 (49 days; n=7, p=0.02) or -PD-L1 (50 days; n=7, p=0.03), and antibodies were compared to the combination of G47Δ-mIL12 with anti-PD-1 (p=0.053) or anti-PD-L1 (p=0.08). Experiment was conducted once (A) or twice (B). C. Mice implanted with 2 × 10⁴ 005 GSCs on day 0 and treated with G47Δ-mIL12 or PBS injected IT on day 8 and anti-(α)CTLA-4 antibody or isotype control IgG (5 mg/kg) injected IP on days 8, 11 and 14 (n=8/group, except for G47Δ-mIL12 n=7). Median survival of Mock (37.5 days) was compared to anti-CTLA-4 (45 days; p=0.002) or G47Δ-mIL12 (40 days; p=0.03) alone by Log-rank analysis. Similarly, combination of G47Δ-mIL12 with anti-CTLA-4 (58 days) was compared to anti-CTLA-4 (p=0.05) or G47Δ-mIL12 (p=0.008). Experiment was conducted 2 times. D. Mice implanted with 2 × 10⁴ 005 GSCs on day 0, treated with PBS (right; n=2), rat anti-(α)PD-1 antibody (middle; 200 μg/mouse; n=2), or rat anti-(α)PD-L1 antibody (left; 200 μg/mouse; n=2) injected IP on day 25, and sacrificed 3 hr later. Antibodies were detected with HRP-conjugated anti-(α)rat Ig (brown; right) or control HRP-conjugated anti-(α)rabbit Ig (left). * normal brain adjacent to tumor. Scale bar=100 μm. E. 005 GSCs (1.5 × 10⁵) implanted on day 0, treated with PBS or G47Δ-mIL12 (5 × 10⁵ pfu) IT on day 11 and IgG or anti-CTLA-4 antibody (5 mg/kg) injected IP on days 11, 14, and 17 (n=4/group; Mock=PBS/IgG), and mice sacrificed on day 18. Tumors were harvested, cells stained with fluorochrome-conjugated anti-mouse antibodies, and multicolor FACS performed. Scatter plot (each animal 1 point) of the percentages of live sorted positive cells. The ratio of Teff to Treg ratio is presented in a bar graph. Mean ± SEM. Data were assessed by Student’s t test between indicated groups; *p<0.05, **p<0.01, ***p<0.001, ****p<0.0001. See also Figure S2 and S3.
Figure 4
Figure 4. Triple combination therapy in 005 and CT-2A glioma models
A. Mice implanted with 2 × 10⁴ 005 GSCs on day 0 and treated with G47Δ-mIL12 (5 × 10⁵ pfu) or PBS injected IT on day 8 (upward arrow) and anti-CTLA-4 (5 mg/kg) and anti-PD-1 (10 mg/kg) or isotype control IgG (5 mg/kg hamster and 10 mg/kg rat IgG) IP on days 8, 11 and 14 (n=9/group; downward arrows). Median survival of Mock (PBS and IgG; 40 days) was compared to the combination of anti-PD-1 and anti-CTLA-4 (55 days; p=0.0002) by Log-rank analysis. Similarly, triple combination treatment with virus (89% of mice surviving long-term) was compared to the combination of anti-PD-1 and anti-CTLA-4 (p<0.0001) or Mock (p<0.0001). Experiment was conducted 3 times. B. Cured mice (n=8) from the triple combination experiment in (A) were re-challenged on day 183 with 5-fold increased number of 005 GSCs (1 × 10⁵) in the contralateral hemisphere (re-challenged). Age matched (8 months) naive mice were implanted as controls (n=5). All re-challenged mice were alive at day 96 post-challenge without tumor; controls had a median survival of 27 days post-challenge (p=0.0001; Log-rank analysis). C. CT-2A cells (1 × 10⁴) implanted in C57Bl/6 mice on day 0, injected IT with G47Δ-mIL12 (1 × 10⁵ pfu) or PBS on day 10 and anti-CTLA-4 antibody and anti-PD-1 antibody or isotype control IgG (5 mg/kg hamster IgG and 10 mg/kg rat IgG) injected IP on days 10, 13 and 16. Median survival of Mock (PBS/IgG) treated mice (20 days; n=9) was compared to G47Δ-mIL12 (21 days; n=8) by Log-rank analysis (p=0.007). Median survival of mice treated with triple combination (66.5 days; 50% of mice surviving long-term) was compared to anti-PD-1 and -CTLA-4 (19 days; n=8, p=0.005) or G47Δ-mIL12 (p=0.01). D. Cured mice (n=4) from the triple combination experiment in (C) were re-challenged on day 109 with 5-fold increased number of CT-2A cells (5 × 10⁴). Similar age naive mice (~6 months) were implanted as controls (n=5). All re-challenged mice were alive at day 46 post-challenge without tumor, and compared to control by Log-rank analysis (p=0.005). See also Figure S4.
Figure 5
Figure 5. FACS analysis of treatment effects of triple combination therapy
(A–C) Mice implanted with 005 GSCs (1.5 × 10⁵) on day 0, treated with G47Δ-mIL12 (5 × 10⁵ pfu) or PBS injected IT on day 11, and anti-PD-1 and anti-CTLA-4 antibody or rat and hamster IgGs (Mock) (5 mg/kg hamster IgG and 10 mg/kg rat IgG) injected IP on days 11, 14, and 17 (n=4), and sacrificed on day 18. Tumors harvested, dissociated cells stained with fluorochrome-conjugated anti-mouse antibodies, and multicolor FACS was performed. Percentages of live CD3+ cells, CD3+ sorted CD4+ and CD8+ subsets, live CD11b+ (monocytes, macrophages, NK, DC), and live CD45 GFP+ 005 cells from 2 independent experiments (red and black symbols) for M, CPi, V, and CPi+V groups (symbols are individual mice) were analyzed (A). The tumors from the experiment with red symbols in (A) were analyzed for CD3+FoxP3+ subtypes and ratio of CD8+ to CD4+FoxP3+ (B). The tumors from the experiment with black symbols in (A) were analyzed for immune checkpoint expression (PD-L1, CTLA-4, PD-1) on CD45+CD3+CD4+ and CD8+ subsets, CD45GFP+, and CD11b+CD45hi and lo cells (C). M, Mock (PBS/IgG); V, virus (G47Δ-mIL12); CPi, checkpoint inhibitors (anti-PD-1+anti-CTLA-4); CPi+V, virus + checkpoint inhibitors (G47Δ-mIL12+anti-PD-1+anti-CTLA-4). Data are mean ± SEM and assessed by Student’s t test between indicated groups; *p<0.05, **p<0.01, ***p<0.001. See also Figure S5.
Figure 6
Figure 6. Immunohistochemical staining of tumor infiltrating cells
(A–D) Mice implanted with 005 GSCs (2 × 10⁴) on day 0, treated with G47Δ-mIL12 (5 × 10⁵ pfu) or PBS injected IT on day 17, and checkpoint inhibitors anti-PD-1 antibody and anti-CTLA-4 antibody or rat and hamster IgGs (5 mg/kg hamster IgG and 10 mg/kg rat IgG) injected IP on days 17, 20, and 23 (n=4), sacrificed on day 24, and brain tumor sections stained as indicated (Mock; PBS/IgG). Representative images with positive cells stained brown are presented (A). PD-L1 staining was from a separate experiment, but same treatment as above (n=3 or 4). Scale bars=100 or 200 μm as indicated. Number of positive cells per field in (A) were counted (3–5 fields/section/mouse for CD68 and Ki67; 8–10 fields/section/mouse for pStat1 and iNOS; 4 fields/section and 2 sections/mouse for PD-L1), and individual mice in each group are identified by color (B). Representative images with positive cells stained red (pSTAT1 +, CD3+), blue (CD68+, Ki67+), and red/blue colocalized (examples indicated with arrows) are presented (C). Scale bar=100 μm. Brain sections were incubated sequentially with primary (pSTAT1 or CD3 rabbit antibody) and secondary antibodies (AP-conjugated anti-rabbit Ig), followed by red color development. The same sections were then incubated with primary (CD68 or Ki67; rabbit antibody) and secondary antibodies (AP-conjugated anti-rabbit Ig), followed by blue color development. Number of positive cells per field were counted (8–10 fields/section/mouse) and percent of double positive cells plotted (D) with individual mice identified by color. M, Mock (PBS/IgG); CPi, checkpoint inhibitors (anti-PD-1+anti-CTLA-4); CPi+V, checkpoint inhibitors + virus (G47Δ-mIL12+anti-PD-1+anti-CTLA-4). Data are mean ± SEM, assessed by Student’s t test between indicated groups; *p<0.05, ***p<0.001, ****p<0.0001. See also Figure S6.
Figure 7
Figure 7. Depletion/inhibition of immune cell subtypes abrogates triple combination therapy
A. C57Bl/6 mice implanted with (2 × 10⁴) 005 GSCs on day 0 and treated with G47Δ-mIL12 or PBS injected IT on day 8 and anti-CTLA-4 and anti-PD-1 antibodies or isotype control IgG (5 mg/kg hamster IgG and 10 mg/kg rat IgG) injected IP on days 8, 11 and 14 (n=6/group; upward arrows). Depletion antibodies against CD4 or CD8 (10 mg/kg) or clodronate liposomes (Clod; first injection 50 mg/kg followed by 25 mg/kg) were injected IP on days 4, 7, 10, 13, 20, and 27 (downward arrows), or BLZ945 (BLZ; 200 mg/kg) was gavaged for two cycles from days 6–10 and days 12–16 in triple therapy mice. Median survival of mice was determined: Mock (PBS/IgG/liposome/20% captisol), 35.5 days or triple therapy +αCD4 antibody, 32.5 days; +BLZ, 41.5 days; +αCD8 antibody, 45 days; +Clod, 43 days; +PBS (IgG/liposome/20% captisol). +PBS was compared to +BLZ (p=0.004), +Clod (p=0.02), +αCD4 (p=0.0007), +αCD8 (p=0.02), or Mock (p=0.0006) by Log-rank analysis. Similarly, Mock was compared to +PBS (p=0.0006), +BLZ (p=0.06), +Clod (p=0.01), +αCD4 (p=0.4), or +αCD8 (p=0.0006). B. C57Bl/6 mice implanted with 005 GSCs (2 × 10⁴) on day 0 and treated with G47Δ-mIL12 (5 × 10⁵ pfu) or PBS injected IT on day 18 and anti-CTLA-4 and anti-PD-1 antibodies or isotype control IgGs (5 mg/kg hamster IgG and 10 mg/kg rat IgG) injected IP on days 18, 21 and 24 (n=2/group). Depletion antibodies (αCD4, αCD8; 10 mg/kg) or Clod (first injection 50 mg/kg followed by 25 mg/kg) were injected IP on days 14, 17, 20, and 23, or BLZ (200 mg/kg) gavaged from days 16–20 and 22–25. Twenty-four hr after the last immune checkpoint injection or 8 hr after the last BLZ gavage, animals were sacrificed on day 25 and brains collected. Brain tumor sections (2 sections/mouse, at least 200 μm apart from each other) were stained for CD4, CD8, CD68, and F4/80. Positive cells were counted (5 fields/section for CD4+ and CD8+, 8 fields/section for CD68+, and 6 fields/section for F4/80+) and presented as mean ± SEM. Data were assessed by Student’s t test between indicated groups *p<0.05, **p<0.01, ***p<0.001, ****p<0.0001. Only significant differences between Mock or triple therapy and other treatments indicated. See also Figure S7.

Comment in

Similar articles

Cited by

References

    1. Agarwalla P, Barnard Z, Fecci P, Dranoff G, Curry WT., Jr Sequential immunotherapy by vaccination with GM-CSF-expressing glioma cells and CTLA-4 blockade effectively treats established murine intracranial tumors. J Immunother. 2012;35:385–389. - PMC - PubMed
    1. Antonia SJ, Lopez-Martin JA, Bendell J, Ott PA, Taylor M, Eder JP, Jager D, Pietanza MC, Le DT, de Braud F, et al. Nivolumab alone and nivolumab plus ipilimumab in recurrent small-cell lung cancer (CheckMate 032): a multicentre, open-label, phase 1/2 trial. Lancet Oncol 2016 - PubMed
    1. Badie B, Schartner JM. Flow cytometric characterization of tumor-associated macrophages in experimental gliomas. Neurosurgery. 2000;46:957–961. discussion 961–952. - PubMed
    1. Binello E, Qadeer ZA, Kothari HP, Emdad L, Germano IM. Stemness of the CT-2A Immunocompetent Mouse Brain Tumor Model: Characterization In Vitro. J Cancer. 2012;3:166–174. - PMC - PubMed
    1. Butowski N, Colman H, De Groot JF, Omuro AM, Nayak L, Wen PY, Cloughesy TF, Marimuthu A, Haidar S, Perry A, et al. Orally administered colony stimulating factor 1 receptor inhibitor PLX3397 in recurrent glioblastoma: an Ivy Foundation Early Phase Clinical Trials Consortium phase II study. Neuro Oncol. 2016;18:557–564. - PMC - PubMed

Publication types

MeSH terms