. 2017 Oct 13;91(21):e00972-17.
doi: 10.1128/JVI.00972-17. Print 2017 Nov 1.

Interferon-Inducible CD169/Siglec1 Attenuates Anti-HIV-1 Effects of Alpha Interferon

Affiliations

Interferon-Inducible CD169/Siglec1 Attenuates Anti-HIV-1 Effects of Alpha Interferon

Hisashi Akiyama et al. J Virol. .

Abstract

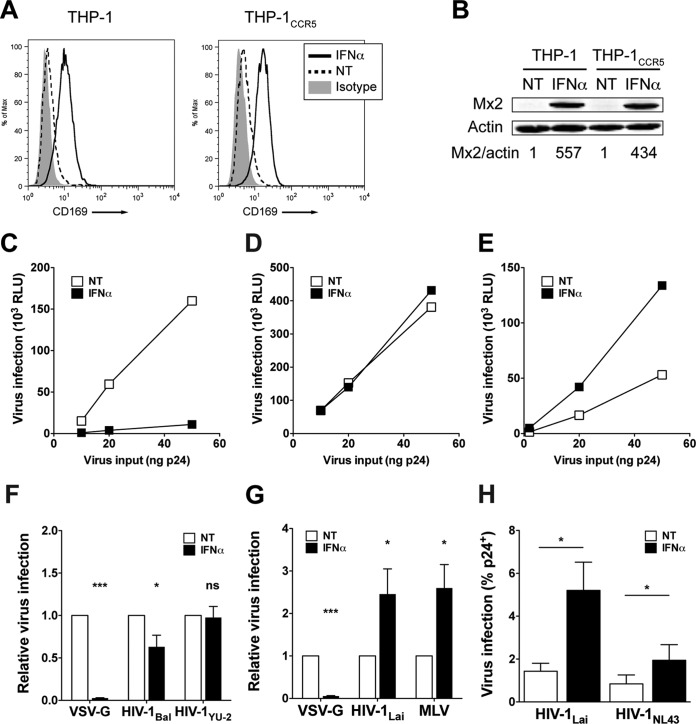
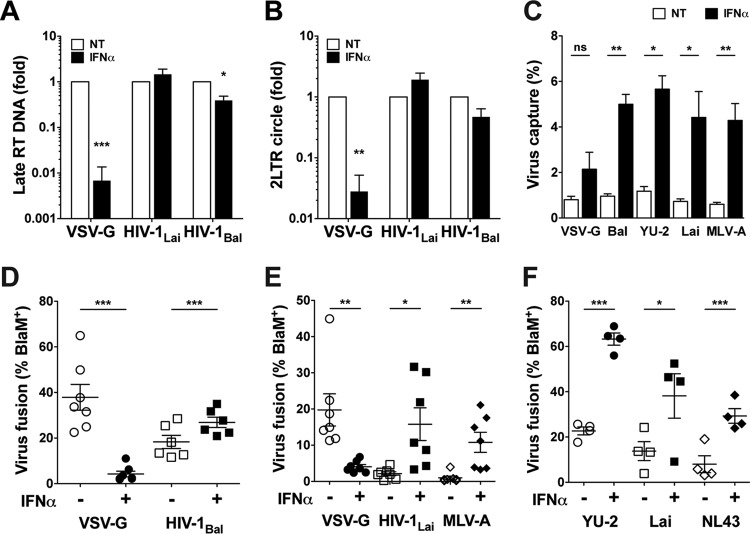
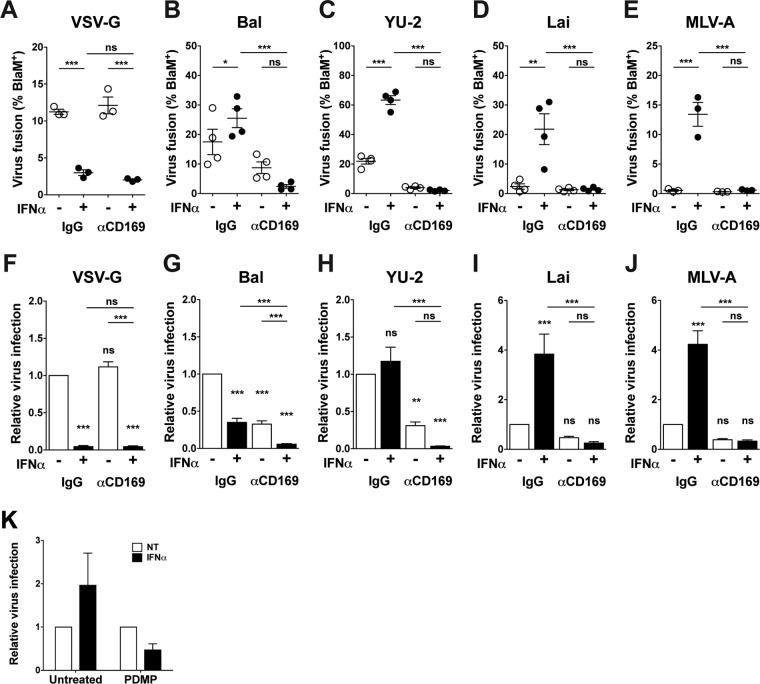
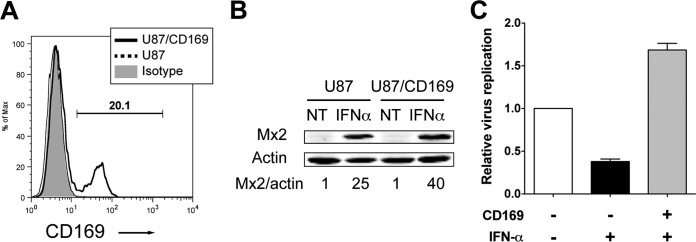
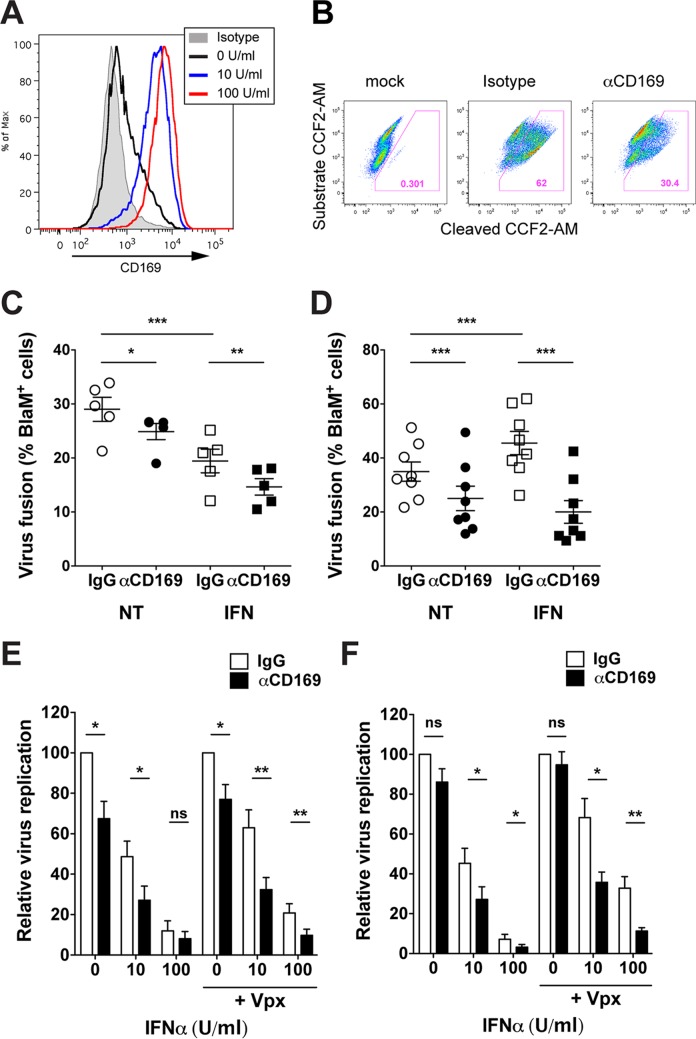
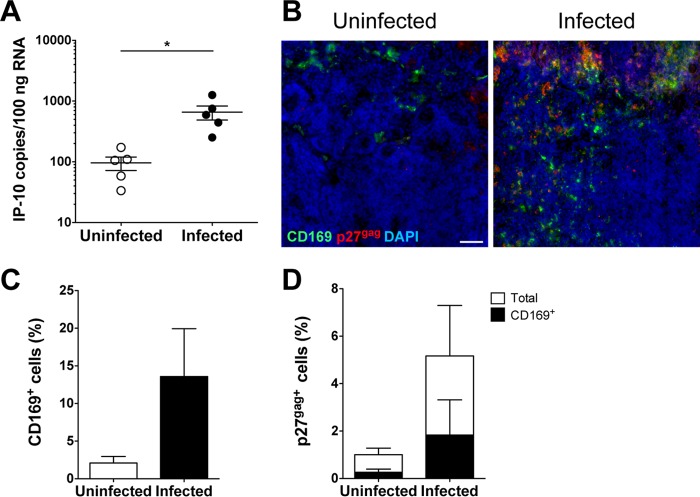
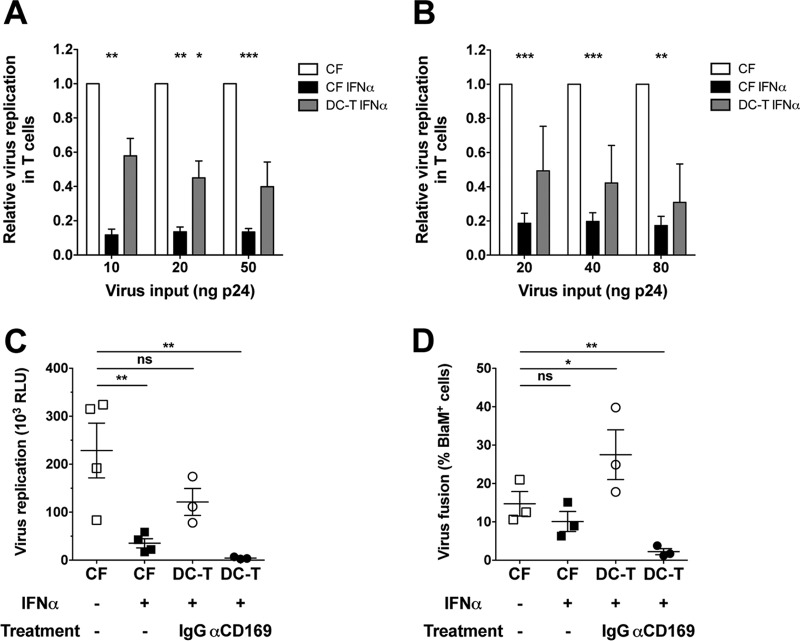
A hallmark of human immunodeficiency virus type 1 (HIV-1) infection in vivo is chronic immune activation concomitant with type I interferon (IFN) production. Although type I IFN induces an antiviral state in many cell types, HIV-1 can replicate in vivo via mechanisms that have remained unclear. We have recently identified a type I IFN-inducible protein, CD169, as the HIV-1 attachment factor on dendritic cells (DCs) that can mediate robust infection of CD4+ T cells in trans Since CD169 expression on macrophages is also induced by type I IFN, we hypothesized that type I IFN-inducible CD169 could facilitate productive HIV-1 infection in myeloid cells in cis and CD4+ T cells in trans and thus offset antiviral effects of type I IFN. In support of this hypothesis, infection of HIV-1 or murine leukemia virus Env (MLV-Env)-pseudotyped HIV-1 particles was enhanced in IFN-α-treated THP-1 monocytoid cells, and this enhancement was primarily dependent on CD169-mediated enhancement at the virus entry step, a phenomenon phenocopied in HIV-1 infections of IFN-α-treated primary monocyte-derived macrophages (MDMs). Furthermore, expression of CD169, a marker of type I IFN-induced immune activation in vivo, was enhanced in lymph nodes from pigtailed macaques infected with simian immunodeficiency virus (SIV) carrying HIV-1 reverse transcriptase (RT-SHIV), compared to uninfected macaques, and interestingly, there was extensive colocalization of p27gag and CD169, suggesting productive infection of CD169+ myeloid cells in vivo While cell-free HIV-1 infection of IFN-α-treated CD4+ T cells was robustly decreased, initiation of infection in trans via coculture with CD169+ IFN-α-treated DCs restored infection, suggesting that HIV-1 exploits CD169 in cis and in trans to attenuate a type I IFN-induced antiviral state.IMPORTANCE HIV-1 infection in humans causes immune activation characterized by elevated levels of proinflammatory cytokines, including type I interferons (IFN). Although type I IFN induces an antiviral state in many cell types in vitro, HIV-1 can replicate in vivo via mechanisms that have remained unclear. In this study, we tested the hypothesis that CD169, a type I IFN-inducible HIV-1 attachment factor, offsets antiviral effects of type I IFN. Infection of HIV-1 was rescued in IFN-α-treated myeloid cells via upregulation of CD169 and a subsequent increase in CD169-dependent virus entry. Furthermore, extensive colocalization of viral Gag and CD169 was observed in lymph nodes of infected pigtailed macaques, suggesting productive infection of CD169+ cells in vivo Treatment of dendritic cell (DC)-T cell cocultures with IFN-α upregulated CD169 expression on DCs and rescued HIV-1 infection of CD4+ T cells in trans, suggesting that HIV-1 exploits CD169 to attenuate type I IFN-induced restrictions.

Keywords: CD169; HIV; type I IFN; virus entry; virus evasion.


Figures

FIG 1
FIG 1
IFN-α treatment of THP-1 cells enhanced HIV-1 infection. (A) Cell surface expression of CD169 on THP-1 and THP-1CCR5 cells left untreated (NT) or treated with 1,000 U/ml of IFN-α was measured by flow cytometry. (B) Western blot analysis of THP-1 cell lysates left untreated or treated with 1,000 U/ml of IFN-α. Mx2 expression was quantified and normalized to the expression of actin, a loading control. The Mx2/actin ratio of THP-1/IFN cells was further normalized to that of untreated THP-1 cells. (C to E) Infection of HIV-1 pseudotyped with VSV-G (C), replication-competent HIV-1 Lai/YU-2env-luc (D), or Lai-Env-pseudotyped HIV-1 in untreated or IFN-α-treated THP-1 cells (C and E) or THP-1CCR5 cells (D). Cells were infected with increasing inputs of HIV-1, and replication was quantified 2 days postinfection by measuring luciferase activity in cell lysates. The experiment was performed three times in duplicate, and the data from a representative experiment are shown. (F) Infection of HIV-1 pseudotyped with VSV-G, HIV-1 Bal Env, or replication-competent HIV-1 Lai/YU-2env-luc in untreated THP-1CCR5 and THP-1CCR5/IFN cells. The luciferase activity in THP-1CCR5/IFN cell lysates 2 days postinfection was normalized to that of THP-1CCR5 cells. The data are the means ± SEMs from five (VSV-G), eight (HIV-1 Bal), or four (Lai/YU-2env) independent experiments performed in duplicate or triplicate. (G) Infection of HIV-1 pseudotyped with VSV-G, HIV-1 Lai Env, or MLV-A Env in untreated THP-1 and THP-1/IFN cells. The luciferase activity in THP-1/IFN cell lysates 2 days postinfection was normalized to that of THP-1 cells. The data are the means ± SEM from seven independent experiments performed in triplicate. (H) Infection of replication-competent HIV-1 Lai and HIV-1 NL4-3 in untreated THP-1 and THP-1/IFN cells at 2 days postinfection was quantified by intracellular p24gag staining. The data are the means ± SEMs from four independent experiments. Two-tailed P values were calculated using one-sample t test (F and G) or paired t test (H) in GraphPad Prism 5. *, P ≤ 0.05; ***, P ≤ 0.001. ns, not significant.
FIG 2
FIG 2
Exposure of THP-1 cells to IFN-α enhances HIV-1 fusion. (A) Quantitative analysis of late reverse transcription products. Untreated or IFN-α-treated THP-1 (for VSV-G or HIV-1 Lai) or THP-1CCR5 (for HIV-1 Bal) cells were infected with HIV-1 pseudotyped with VSV-G and replication-competent HIV-1 Lai and HIV-1 Lai/Balenv and lysed at 24 h postinfection for measurement of viral DNA by quantitative PCR. The amount of late reverse transcription products (A) or 2LTR circles (B) in IFN-α-treated THP-1 cells was normalized to that of untreated THP-1 cells. The data are the means ± SEMs from three independent experiments. (C) Binding of HIV-1 particles pseudotyped with VSV-G (n = 7, THP-1), HIV-1 Bal (n = 5, THP-1CCR5), HIV-1 Lai (n = 7, THP-1), MLV-A (n = 7, THP-1), or replication-competent HIV-1 Lai/YU-2env (n = 3, THP-1CCR5) to untreated THP-1 or THP-1/IFN cells was quantified by an ELISA, and the percent binding was calculated. The data are the means ± SEMs from independent experiments. (D) Virus fusion of HIV-1 pseudotyped with VSV-G or HIV-1 BalEnv in untreated THP-1CCR5 or THP-1CCR5/IFN cells was quantified. Each symbol represents the percentage of BlaM+ cells obtained from an independent experiment, and the means ± SEMs are shown. (E) Virus fusion of HIV-1 pseudotyped with VSV-G, MLV-A Env, or HIV-1 Lai Env in untreated THP-1 or THP-1/IFN cells was quantified. Each symbol represents the percentage of BlaM+ cells obtained from an independent experiment, and the means ± SEMs are shown. (F) Virus fusion of replication-competent HIV-1 Lai/YU-2env (YU-2) in untreated THP-1CCR5 or THP-1CCR5/IFN or HIV-1 Lai and HIV-1 NL4-3 in untreated THP-1 or THP-1/IFN cells was quantified. Each symbol represents the percentage of BlaM+ cells obtained from an independent experiment, and the means ± SEMs are shown. Two-tailed P values were calculated using one-sample t test (A and B) or paired t test (C to F) in GraphPad Prism 5. *, P ≤ 0.05; **, P ≤ 0.01; ***, P ≤ 0.001.
FIG 3
FIG 3
IFN-α-induced CD169 expression on THP-1 cells enhances HIV-1 fusion and infection. (A to E) Untreated THP-1 or THP-1CCR5 or IFN-treated THP-1 or THP-1CCR5 cells were incubated with isotype-matched control IgG (IgG) or anti-CD169 blocking antibody and infected with VSV-G-pseudotyped HIV-1 (VSV-G) (A), Bal Env-pseudotyped HIV-1 (B), replication-competent HIV-1 Lai/YU-2env (YU-2) (C), Lai Env-pseudotyped HIV-1 (Lai) (D), or MLV-A Env-pseudotyped HIV-1 (E), and virus fusion in these cells was quantified. Each symbol represents the percentage of BlaM+ cells obtained from an independent experiment, and the means ± SEMs are shown. (F to J) Untreated THP-1 or THP-1CCR5 or IFN-treated THP-1 or THP-1CCR5 cells were infected with VSV-G-pseudotyped HIV-1 (F), Bal Env-pseudotyped HIV-1 (G), replication-competent HIV-1 Lai/YU-2env (H), Lai Env-pseudotyped HIV-1 (I), or MLV-A Env-pseudotyped HIV-1 (J) in the presence of either anti-CD169 blocking antibody or isotype-matched control IgG. Virus infection was quantified by measuring luciferase activity in cell lysates 2 days postinfection and was normalized to the values in untreated cells (no IFN-α). The data are the means ± SEMs from independent experiments performed in duplicate or triplicate (n = 4 for panel F, n = 5 for panel G, n = 4 for panel H, n = 6 for panel I, and n = 6 for panel J). (K) Infection of HIV-1 pseudotyped with HIV-1 Lai Env produced from untreated cells (NT; GSL-enriched virions) or PDMP-treated cells (PDMP; GSL-deficient virions) in THP-1 and THP-1/IFN cells. The luciferase activity in cell lysates 2 days postinfection was normalized to that of untreated THP-1 cells. The data are the means ± SDs from two independent experiments performed in triplicate. Two-tailed P values were calculated using one-way analysis of variance (ANOVA) followed by the Tukey-Kramer posttest (A to J, shown with lines) or the Dunnett's posttest (F to J, shown just above each column, compared to untreated cells [first column]) in GraphPad Prism 5. *, P ≤ 0.05; **, P ≤ 0.01; ***, P ≤ 0.001.
FIG 4
FIG 4
Exogenous CD169 expression in U87 attenuates the effects of ISGs. (A) Cell surface expression of CD169 on parental U87 cells (U87) and CD169-transduced U87 cells (U87/CD169). (B) Western blot analysis of U87 cell or U87/CD169 cell lysates left untreated or treated with 1,000 U/ml of IFN-α. Mx2 expression was quantified and normalized to the expression of actin, a loading control. The Mx2/actin ratio of IFN-α-treated U87 or U87/CD169 cells was further normalized to that of untreated cells. (C) Infection of HIV-1 pseudotyped with HIV-1 Bal Env in untreated U87, IFN-α-treated U87, or IFN-α-treated U87/CD169 cells was quantified 2 days postinfection by measuring luciferase activity in cell lysates. The data are the means ± SDs from two independent experiments performed in triplicate.
FIG 5
FIG 5
Induced CD169 expression on MDMs enhances HIV-1 replication in the presence of IFN-α. (A) Cell surface expression of CD169 on MDMs treated with different doses of IFN-α. (B) Representative FACS profiles of BlaM+ MDMs pretreated with 100 U/ml IFN-α for 2 days and infected with BlaM-Vpr containing HIV-1 Lai/YU-2env in the absence or presence of anti-CD169 blocking antibody or isotype-matched IgG. (C and D) The percentage of BlaM+ MDMs from multiple infections with HIV-1 Lai/Balenv (C) or HIV-1 Lai/YU-2env (D) and the means ± SEM are shown. Each symbol represents data obtained from cells derived from an independent donor. (E and F) MDMs were pretreated with the indicated doses of IFN-α for 2 days, left uninfected or infected with SIVmac239 Vpx-containing VLPs, and then incubated with isotype-matched IgG (IgG) or anti-CD169 blocking antibody prior to infection with HIV-1 Lai/Balenv-luc (E) or HIV-1 Lai/YU-2env-luc (F) reporter virus. HIV-1 infection was quantified 3 days postinfection by measuring luciferase activity in cell lysates, and values were normalized to those from untreated MDMs with isotype-matched IgG. The data are the means ± SEMs from six (E) and five (F) independent experiments performed using cells from different donors. Two-tailed P values were calculated using one-way ANOVA followed by the Tukey-Kramer posttest (C and D) or paired t test (E and F) in GraphPad Prism 5. *, P ≤ 0.05; **, P ≤ 0.01; ***, P ≤ 0.001.
FIG 6
FIG 6
CD169+ cells in LNs were infected with SHIV in the presence of type I IFN signatures in vivo. (A) Quantification of IP-10 mRNAs in mesenteric LNs. RNA was extracted from frozen tissues which were removed from uninfected (n = 5) or SHIV-infected (n = 5) macaques upon necropsy, and IP-10 mRNA was quantitated by custom digital molecular barcoding using the NanoString nCounter system. Two-tailed P values were calculated using unpaired t test in GraphPad Prism 5. *, P ≤ 0.05. (B) Representative images of immunofluorescence staining of mesenteric LNs of uninfected and SHIV-infected macaques. Frozen tissues were stained for CD169 (green), p27gag (red), and nuclei (blue). Scale bar = 100 μm. (C and D) Quantitation of CD169+ cells and SHIV-infected cells (p27gag+) in LNs of uninfected (n = 3) and SHIV-infected (n = 4) macaques. CD169+ cells and p27gag+ cells were counted by automated imaging software for 4 to 7 fields per LN. The percentage of CD169+ cells in total cells (C) or p27gag+ cells and doubly positive (CD169+ p27gag+) cells in total cells (D) was calculated, and the means ± SEMs are shown.
FIG 7
FIG 7
CD169 on mature DCs attenuates the effects of ISGs in trans-infection. (A and B) CD4+ T cells left untreated (CF) or treated with IFN-α (CF IFN-α) were infected with the indicated doses of X4-tropic (Lai-luc) (A) or R5-tropic (B) HIV-1 (Lai/Balenv-luc) reporter viruses. Alternatively, IFN-DCs were pulsed with the indicated amounts of X4-tropic or R5-tropic viruses, washed, and cocultured with IFN-α-treated CD4+ T cells (DC-T IFN-α). Infection in CD4+ T cells was quantified at 3 days postinfection by measuring luciferase activity in cell lysates. The data are the means ± SEMs from independent experiments performed in triplicates using cells from three (A) or four (B) different donors. (C) CD4+ T cells with or without IFN-α pretreatment were exposed to cell-free HIV-1 Lai-luc as for panel A. Alternatively, IFN-DCs were treated with isotype-matched IgG or anti-CD169 blocking antibody prior to incubation with HIV-1, washed, and added to IFN-α-treated CD4+ T cells. Infection in CD4+ T cells was quantified at 3 days postinfection by measuring luciferase activity in cell lysates. The data are the means ± SEMs, and each symbol represents data obtained from cells derived from an independent donor. (D) CD4+ T cells were infected with cell-free virus or IFN-DC-laden virus as for panel C except that HIV-1 Lai-luc containing BlaM-Vpr was used. HIV-1 fusion in CD4+ T cells was quantified at 4 h postinfection. The data are the means ± SEMs, and each symbol represents data obtained from cells derived from an independent donor. Two-tailed P values were calculated using one-sample t test (A and B) or one-way ANOVA followed by the Tukey-Kramer posttest (C and D) in GraphPad Prism 5. *, P ≤ 0.05; **, P ≤ 0.01; ***, P ≤ 0.001.

Similar articles

Cited by

References

    1. Stacey AR, Norris PJ, Qin L, Haygreen EA, Taylor E, Heitman J, Lebedeva M, DeCamp A, Li D, Grove D, Self SG, Borrow P. 2009. Induction of a striking systemic cytokine cascade prior to peak viremia in acute human immunodeficiency virus type 1 infection, in contrast to more modest and delayed responses in acute hepatitis B and C virus infections. J Virol 83:3719–3733. doi:10.1128/JVI.01844-08. - DOI - PMC - PubMed
    1. Colonna M, Trinchieri G, Liu YJ. 2004. Plasmacytoid dendritic cells in immunity. Nat Immunol 5:1219–1226. doi:10.1038/ni1141. - DOI - PubMed
    1. Beignon AS, McKenna K, Skoberne M, Manches O, DaSilva I, Kavanagh DG, Larsson M, Gorelick RJ, Lifson JD, Bhardwaj N. 2005. Endocytosis of HIV-1 activates plasmacytoid dendritic cells via Toll-like receptor-viral RNA interactions. J Clin Invest 115:3265–3275. doi:10.1172/JCI26032. - DOI - PMC - PubMed
    1. Fonteneau JF, Larsson M, Beignon AS, McKenna K, Dasilva I, Amara A, Liu YJ, Lifson JD, Littman DR, Bhardwaj N. 2004. Human immunodeficiency virus type 1 activates plasmacytoid dendritic cells and concomitantly induces the bystander maturation of myeloid dendritic cells. J Virol 78:5223–5232. doi:10.1128/JVI.78.10.5223-5232.2004. - DOI - PMC - PubMed
    1. O'Brien M, Manches O, Bhardwaj N. 2013. Plasmacytoid dendritic cells in HIV infection. Adv Exp Med Biol 762:71–107. doi:10.1007/978-1-4614-4433-6_3. - DOI - PMC - PubMed

Publication types

MeSH terms