Comparative Study
. 2017 Aug 7;12(8):e0182130.
doi: 10.1371/journal.pone.0182130. eCollection 2017.

Massively parallel unsupervised single-particle cryo-EM data clustering via statistical manifold learning

Affiliations
Comparative Study

Massively parallel unsupervised single-particle cryo-EM data clustering via statistical manifold learning

Jiayi Wu et al. PLoS One. .

Abstract

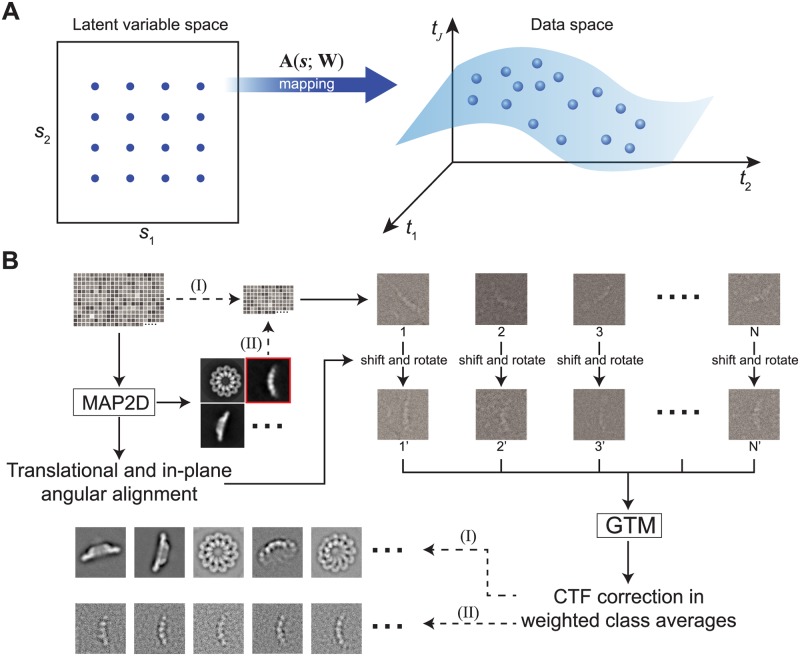
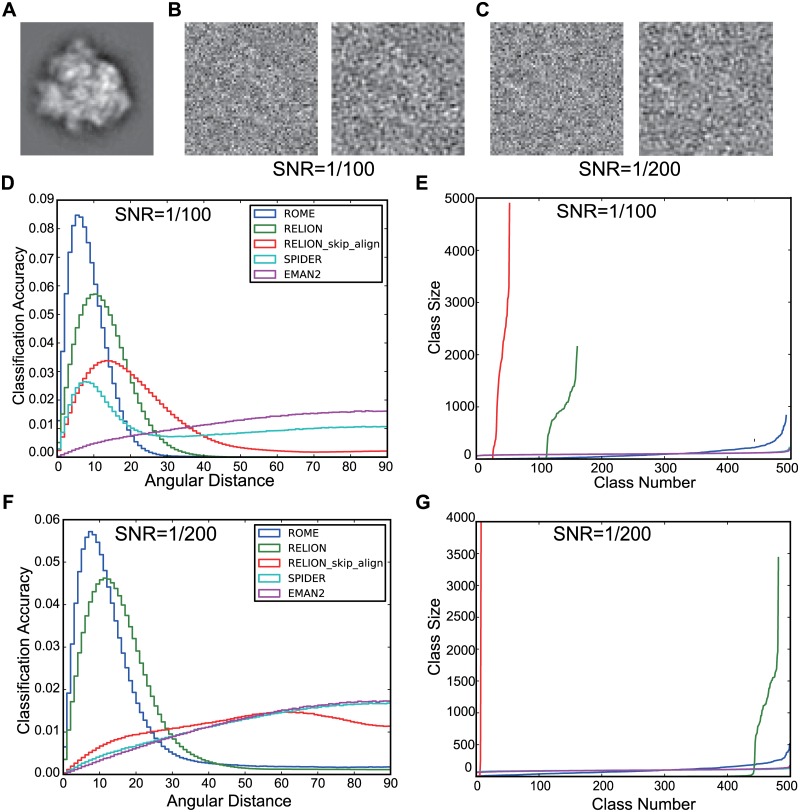
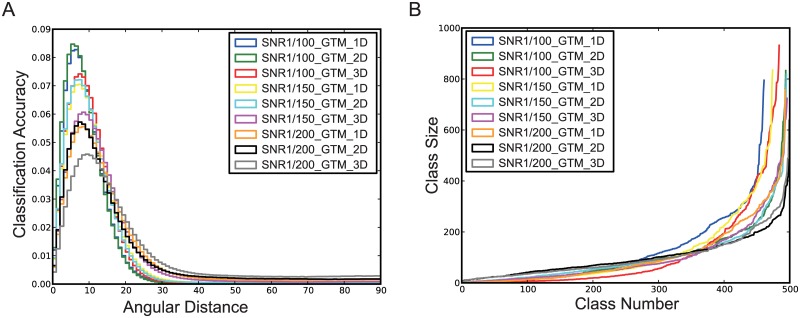
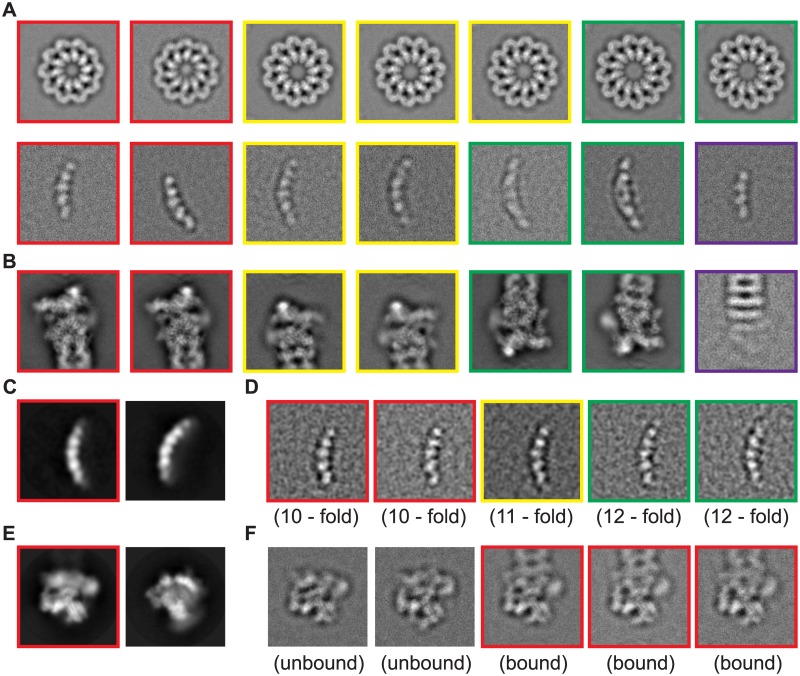
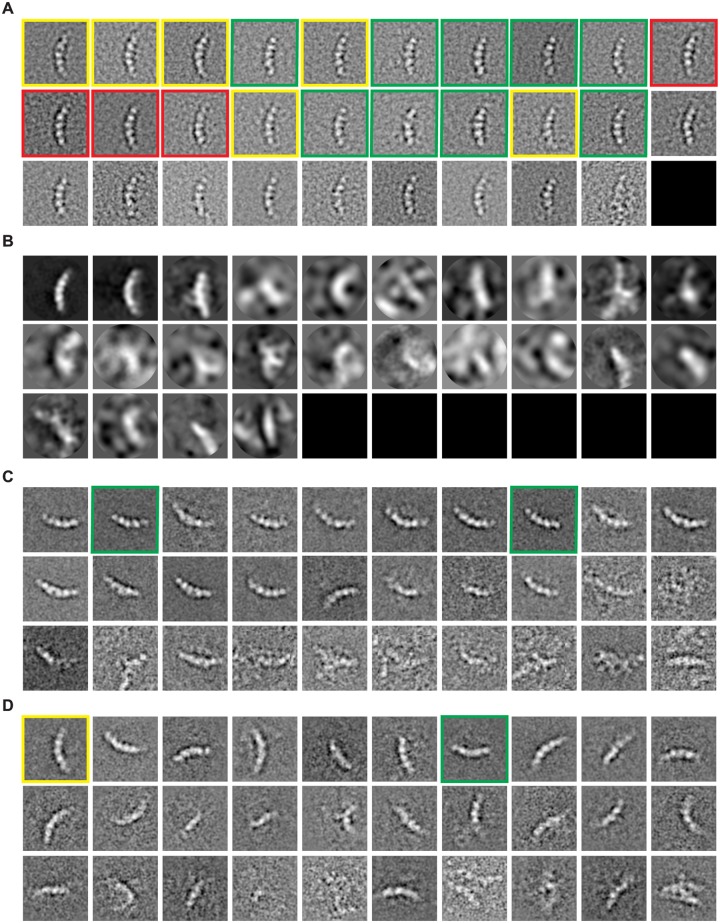
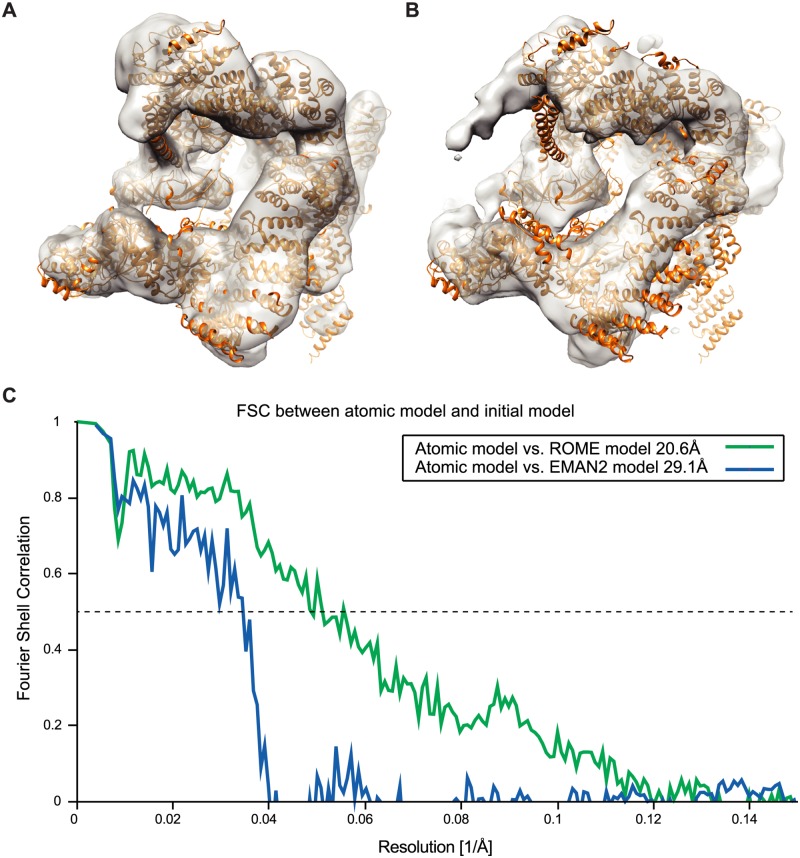
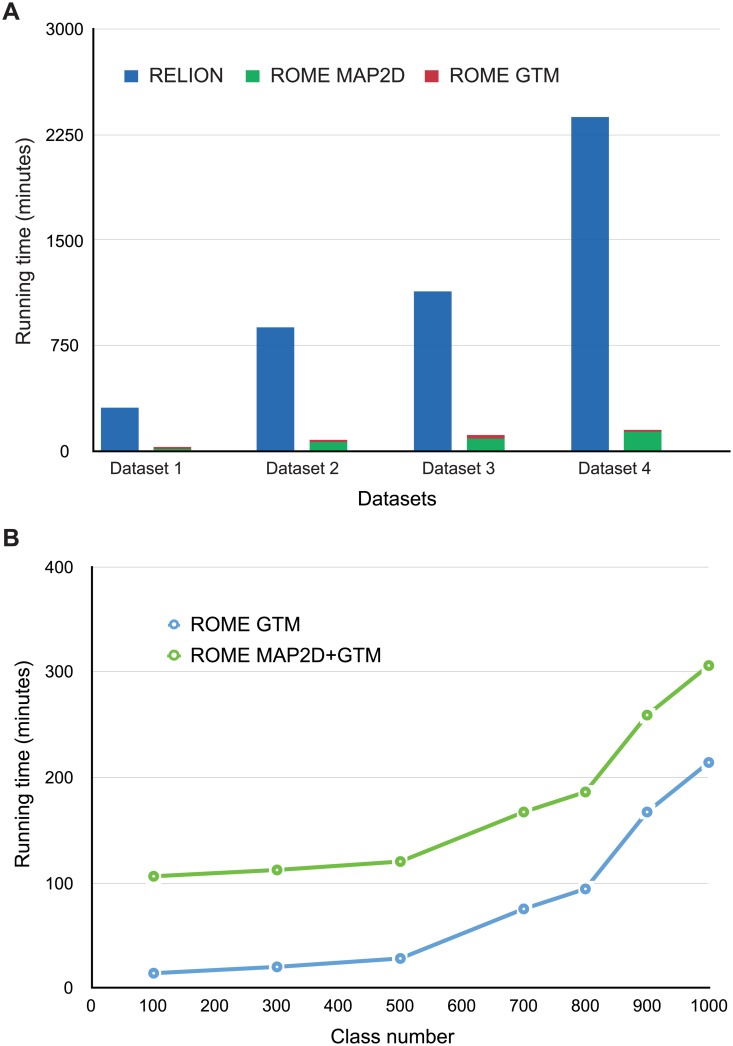
Structural heterogeneity in single-particle cryo-electron microscopy (cryo-EM) data represents a major challenge for high-resolution structure determination. Unsupervised classification may serve as the first step in the assessment of structural heterogeneity. However, traditional algorithms for unsupervised classification, such as K-means clustering and maximum likelihood optimization, may classify images into wrong classes with decreasing signal-to-noise-ratio (SNR) in the image data, yet demand increased computational costs. Overcoming these limitations requires further development of clustering algorithms for high-performance cryo-EM data processing. Here we introduce an unsupervised single-particle clustering algorithm derived from a statistical manifold learning framework called generative topographic mapping (GTM). We show that unsupervised GTM clustering improves classification accuracy by about 40% in the absence of input references for data with lower SNRs. Applications to several experimental datasets suggest that our algorithm can detect subtle structural differences among classes via a hierarchical clustering strategy. After code optimization over a high-performance computing (HPC) environment, our software implementation was able to generate thousands of reference-free class averages within hours in a massively parallel fashion, which allows a significant improvement on ab initio 3D reconstruction and assists in the computational purification of homogeneous datasets for high-resolution visualization.


Conflict of interest statement

Competing Interests: The authors C.C. and B.B. are affiliated with Intel Corporation. This does not alter our adherence to PLOS ONE policies on sharing data and materials.

Figures

Fig 1
Fig 1. Strategy for unsupervised single-particle clustering via statistical manifold learning.
(A) The fundamental principle of GTM is to establish a numerical relationship between variables in the latent space and a non-Euclidean manifold composed of the Fourier transformed image data in the data space. The manifold embedding can be determined by a set of nonlinear basis functions and a weighted parametric matrix. The likelihood function for the nonlinear mapping is solved by the expectation-maximization algorithm. (B) The workflow of implementing the unsupervised clustering strategies in ROME is as follows: (I) All images are aligned using MAP2D in a reference-free manner, and are subsequently classified into many groups by unsupervised GTM. (II) The unsupervised classes obtained in step (I) are further classified into many sub-classes by unsupervised GTM in a hierarchical fashion.
Fig 2
Fig 2. Benchmarking the performance of unsupervised clustering using simulated data.
(A) A projection of the 70S ribosome model. (B and C) Examples of the simulated images of the 70S ribosome with SNRs of 1/100 (B) and 1/200 (C). The right panel in (B) and (C) shows the low-pass filtered version of each simulated image. (D and F) The normalized histogram exhibits the distributions of angular distances resulting from the five classification methods that were applied to the simulated images with SNRs of 1/100 (panel D) and 1/200 (panel F). (E and G) The sizes of classes were ranked for the five classification methods with SNRs of 1/100 (panel E) and 1/200 (panel G).
Fig 3
Fig 3. Classification accuracy with one-, two- and three-dimensional latent space in our GTM algorithm.
(A) Normalized histograms exhibit the angular distances for the one- and two-dimensional latent space under different SNRs. (B) The sizes of classes are for different latent space dimensions with varying SNRs. The label ‘GTM_D’ in (A) and (B) represents the number of dimensions. GTM_1D denotes that 500 points in one dimensional latent space were sampled in the GTM algorithm. GTM_2D denotes that 100 points in one dimension and 5 points in the other dimension, a total of 500 points, were sampled by the GTM algorithm. GTM_3D denotes that 20 points in the first dimension and 5 points in each of the other two dimensions, giving a total 500 points, were sampled in the GTM algorithm.
Fig 4
Fig 4. Unsupervised clustering by GTM.
(A) Typical class averages of inflammasome particles generated by unsupervised GTM clustering in ROME. Red, yellow and green boxes indicate the top views (first row) and the side views (second row) of 10-, 11-, and 12-fold inflammasome complex, respectively. The side views of the complex structure differ by length. Besides, the purple box denotes the class average of an incomplete inflammasome complex. (B) Typical class averages of RP-CP sub-complexes generated by unsupervised GTM in ROME. The red or yellow boxes indicate a pair of class averages showing differences in local features corresponding to the local movement of the Rpn5 subunit of the RP-CP subcomplex [7]. The green box indicates a pair of class averages showing the movement of the Rpn1 subunit of RP-CP subcomplex [7]. The purple box labels the class average of the incomplete RP-CP subcomplex. (C) Typical side-view class averages of the inflammasome were initially classified using the MAP2D classifier in a reference-free manner. Two classes among 50 classes visually resemble the 11-fold inflammasome complex particles. (D) The class average highlighted by red box in panel (C) was further classified by GTM. The red boxes indicate the 11-fold inflammasome particles. The green boxes indicate the 10-fold inflammasome particles that were misclassified by MAP2D into the same class as the rest 11-fold structures. The yellow boxes indicate the 12-fold inflammasome particles that were misclassified by MAP2D into the same class as the rest of the 11-fold structures. (E) A 57,001-particle dataset of free RP was initially classified using the MAP2D classifier in a reference-free manner. (F) The class marked by the red box in panel (E) was further classified by GTM in ROME. Several classes of RP-CP sub-complex particles (red boxes) were found to be misclassified into this free RP class.
Fig 5
Fig 5. Comparison of hierarchical unsupervised clustering using ROME, RELION, SPIDER and EMAN2.
(A) Unsupervised classification of a MAP2D-generated class into 30 sub-classes using the GTM algorithm in ROME. The red box marks the side view projection of the 11-fold inflammasome complex. The green box marks the side view projection of the 10-fold inflammasome complex, whose length is smaller than that of the others. The yellow box marks the side view projection of the 12-fold inflammasome complex, whose length is larger than that of the others. (B) Unsupervised classification of the same MAP2D-generated class into 30 sub-classes in RELION. The major class exhibits the side view projections of 11-fold inflammasome complex, whereas all the other classes present ‘junk’ features. (C) Unsupervised K-means clustering of the same MAP2D-generated class into 30 sub-classes in SPIDER. The green boxes highlight the side views of the 10-fold inflammasome complex, whose length is smaller than others. The yellow boxes label the side view projections of the 12-fold inflammasome complex, whose length is larger than that of the others. (D) Unsupervised K-means clustering of the same MAP2D-generated class into 30 sub-classes in EMAN2. The yellow boxes label the side view projections of the 12-fold inflammasome complex, whose length is longer than that of the others. The green boxes label the side view projections of 10-fold inflammasome complex, whose length is shorter than that of the others.
Fig 6
Fig 6. Initial 3D reconstruction from the reference-free class averages of ROME and EMAN2.
(A) The initial reconstruction calculated by the ROME-generated class averages is superimposed with the atomic model of free RP shown in a ribbon representation, suggesting that they are highly compatible with each other. (B) The initial reconstruction calculated by the EMAN2-generated class averages is superimposed over the atomic model of free RP shown in a ribbon representation. A substantial part of the atomic model is outside of the density of the initial reconstruction, suggesting poor map quality and a large reconstruction error. (C) FSC curves between the RP atomic model and the initial reconstructions generated by ROME- and EMAN2-based class averages.
Fig 7
Fig 7. Performance evaluation of unsupervised clustering with ROME.
(A) Performance of unsupervised single-particle clustering in ROME versus RELION using different datasets. Unsupervised 2D classification into 300 classes using both software programs were performed on four experimental datasets: Dataset1 refers to the 16,306-particle dataset of the inflammasome with 250×250 box size; dataset2 refers to the 35,407-particle dataset of the free RP complex with 160×160 box size; dataset3 refers to the 96,488-particle dataset of the RP-CP complex with 160×160 box size; dataset4 refers to the 57,001-particle dataset of the free RP complex with 180×180 box size. MAP2D alignment in ROME and GTM clustering for 300 classes wes also performed. The blue, green, and red histograms represent the running time of RELION, MAP2D in ROME, and GTM in ROME, respectively. For more comparison, see S9 Fig and S1 Table. (B) The 96,488-particle dataset of the RP-CP subcomplex was used to test the performance of GTM in ROME (blue dots). The green dots represent the total running time including both the MAP2D alignment and GTM clustering in ROME. The running time was polynomially related to the number of classes.

Similar articles

Cited by

References

    1. Frank J. Three-dimensional electron microscopy of macromolecular assemblies: visualization of biological molecules in their native state: Oxford University Press; 2006.
    1. Nogales E. The development of cryo-EM into a mainstream structural biology technique. Nature methods. 2016;13(1):24–7. - PMC - PubMed
    1. Scheres SH, Gao H, Valle M, Herman GT, Eggermont PP, Frank J, et al. Disentangling conformational states of macromolecules in 3D-EM through likelihood optimization. Nature methods. 2007;4(1):27–9. doi: 10.1038/nmeth992 - DOI - PubMed
    1. Katsevich E, Katsevich A, Singer A. Covariance matrix estimation for the cryo-EM heterogeneity problem. SIAM journal on imaging sciences. 2015;8(1):126–85. doi: 10.1137/130935434 - DOI - PMC - PubMed
    1. Schwander P, Fung R, Ourmazd A. Conformations of macromolecules and their complexes from heterogeneous datasets. Phil Trans R Soc B. 2014;369(1647):20130567 doi: 10.1098/rstb.2013.0567 - DOI - PMC - PubMed

Publication types

MeSH terms

Substances

LinkOut - more resources