. 2017 Jun 28;3(6):e1700338.
doi: 10.1126/sciadv.1700338. eCollection 2017 Jun.

HIV virions sense plasma membrane heterogeneity for cell entry

Affiliations

HIV virions sense plasma membrane heterogeneity for cell entry

Sung-Tae Yang et al. Sci Adv. .

Abstract

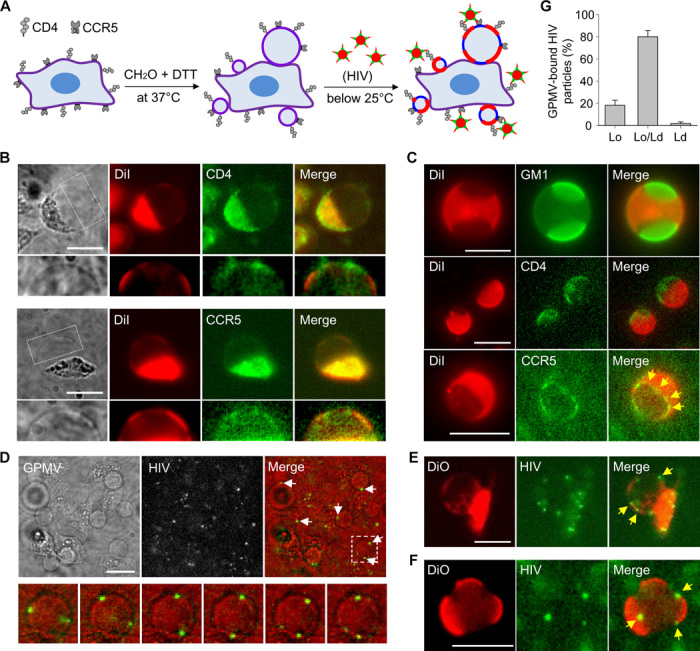
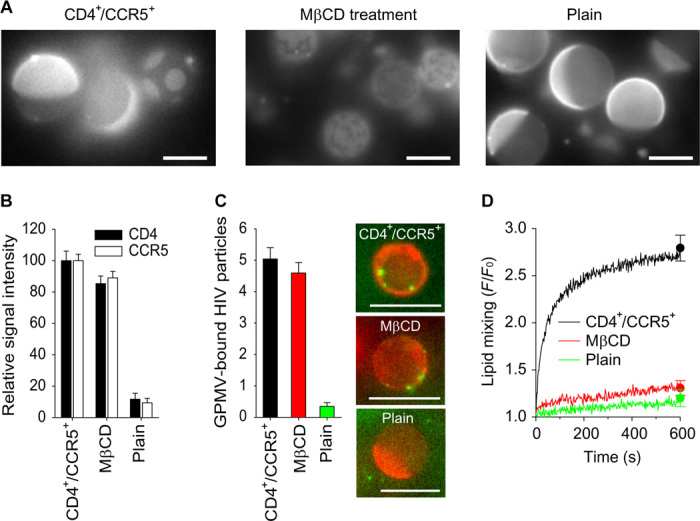
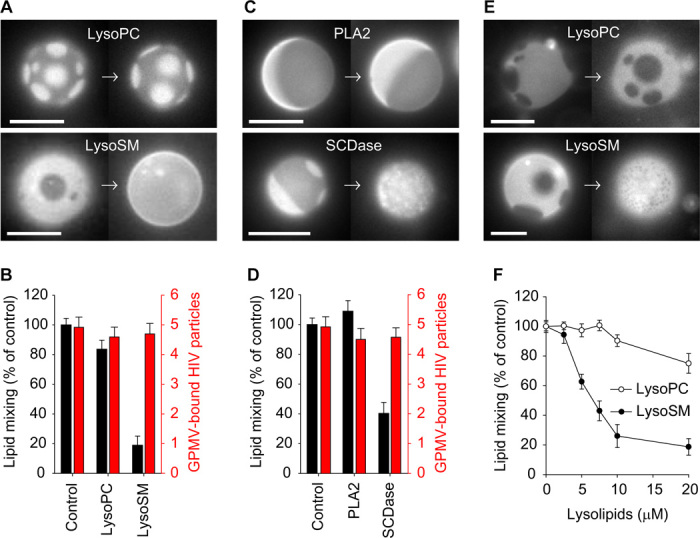
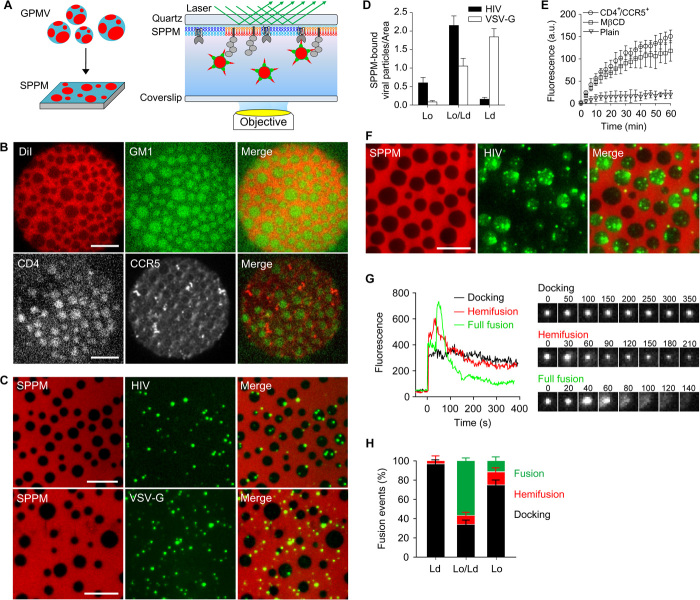
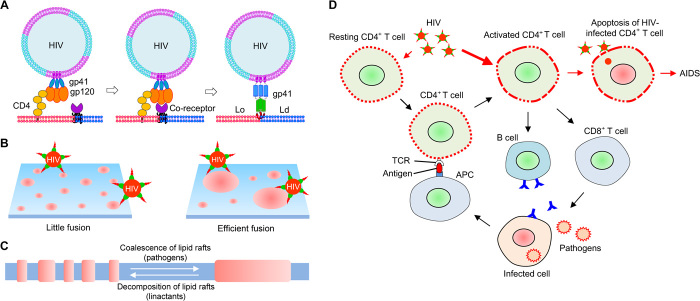
It has been proposed that cholesterol in host cell membranes plays a pivotal role for cell entry of HIV. However, it remains largely unknown why virions prefer cholesterol-rich heterogeneous membranes to uniformly fluid membranes for membrane fusion. Using giant plasma membrane vesicles containing cholesterol-rich ordered and cholesterol-poor fluid lipid domains, we demonstrate that the HIV receptor CD4 is substantially sequestered into ordered domains, whereas the co-receptor CCR5 localizes preferentially at ordered/disordered domain boundaries. We also show that HIV does not fuse from within ordered regions of the plasma membrane but rather at their boundaries. Ordered/disordered lipid domain coexistence is not required for HIV attachment but is a prerequisite for successful fusion. We propose that HIV virions sense and exploit membrane discontinuities to gain entry into cells. This study provides surprising answers to the long-standing question about the roles of cholesterol and ordered lipid domains in cell entry of HIV and perhaps other enveloped viruses.

Keywords: HIV; cell entry; cholesterol; membrane domain; membrane fusion.


Figures

Fig. 1
Fig. 1. HIV Env particles bind to Lo/Ld boundaries of GPMVs derived from CD4+/CCR5+ HeLa cells.
(A) Schematic drawing of the experimental design to understand the role of ordered lipid domains in HIV entry. The preparation of large-scale phase-separated GPMVs facilitates the study of the lateral distribution of CD4 and CCR5 and the role of ordered lipid domains in HIV entry. Lo and Ld phases on GPMVs are indicated with red and blue lines, respectively. (B and C) Partitioning of CD4 and CCR5 in cell-attached (B) or cell-detached (C) GPMVs. GPMVs were first stained with 1,1′-didodecyl-3,3,3′,3′-tetramethylindodicarbocyanine perchlorate (DiI) at 4°C for 60 min and then incubated with fluorescent-labeled CTxB (Alexa Fluor 555), anti-CD4 (Alexa Fluor 488), or anti-CCR5 (Alexa Fluor 647) antibodies at 4°C for 60 min. Epifluorescence images of GPMVs performed at room temperature (~22°C) show large-scale Lo/Ld phase coexistence in which DiI and CTxB are used as markers of Ld and Lo phases, respectively. The selected rectangles are enlarged and shown below. (D) HIV binding to cell-attached GPMVs. Cell-attached GPMVs (left) and viruses labeled with mKO-Gag (center) are visualized by bright-field and epifluorescence microscopy, respectively. Image overlay (right) shows that some bright dots (HIV Env particles) indicated by arrows are sitting on the GPMV surface (top). Time series of images from the selected box region shows that the particles bound to GPMV are free to move laterally along the GPMV surface (bottom). A movie version of this figure is available (movie S3). (E and F) HIV binding to the boundaries between Lo and Ld phases in cell-attached (E) or cell-detached (F) GPMVs. GPMVs (left) and HIV Env particles (center) were labeled with DiO and mKO-Gag, respectively. (G) Quantification of virions bound to three different regions (Lo, Ld, and Lo/Ld boundary) of the GPMVs. Data are means ± SD of triplicates. A total of 120 virions were analyzed for their distribution between the three compartments. The largest fraction of virions was found in Lo/Ld boundary regions. Scale bars, 10 μm.
Fig. 2
Fig. 2. HIV Env particles fuse with CD4+/CCR5+ GPMVs.
(A) Lipid mixing of HIV Env particles with GPMVs depends on the presence of CD4+ and CCR5+. R18-labeled HIV Env particles (1 × 10⁸) were added to different concentrations of unlabeled CD4+/CCR5+ or CD4/CCR5 GPMVs at room temperature. Data are means ± SEM (n = 3). (B) Effect of HIV entry inhibitors on lipid mixing between HIV and GPMVs. Particles (1 × 10⁸) were added to unlabeled CD4+/CCR5+ GPMVs (50 μg/ml of total protein) in the presence of enfuvirtide (10 μg/ml) or maraviroc (10 μg/ml). (C and D) Influence of HIV entry inhibitors on the distribution of GPMV-bound HIV Env particles. Quantification of HIV Env particles bound to three different regions (Lo, Ld, and Lo/Ld boundary) of the GPMVs (n ≥ 25). Data are means ± SD. (E) Single HIV Env particles fuse with GPMVs at Lo/Ld domain boundaries. Epifluorescence micrographs of R18-labeled HIV Env particles bound to GPMVs stained with DiO were taken after incubation for 30 min at room temperature. A time series of images shows the fusion of a single HIV Env particle (indicated by an arrow) with a GPMV at the domain boundary. Scale bar, 10 μm. (F) CryoEM projection images of HIV Env particles. Scale bars, 100 nm. (G) CryoEM evidence for interaction of virions with GPMVs. Inset shows an enlarged image of the contact and/or initial fusion site between HIV and GPMV. Note that the lipid bilayer of the GPMV exhibits continuous density and a deformation in the contact area. Scale bar, 100 nm. Additional cryoEM images of HIV Env particles bound to GPMVs are presented in fig. S6.
Fig. 3
Fig. 3. Effect of cholesterol depletion on lipid phases of GPMVs and their fusion with HIV Env particles.
(A) Effect of cholesterol depletion on lipid phases of GPMVs stained with DiI. Representative images of GPMVs isolated from CD4+/CCR5+ HeLa cells before (left) and after (center) treatment with 5 mM MβCD and from plain (CD4/CCR5) HeLa cells (right). (B) Quantification of CD4 or CCR5 expression on the surface of GPMVs. The relative amounts of CD4 or CCR5 on GPMVs were quantified by immunofluorescence on GPMVs. (C) Quantification of HIV binding to GPMVs. The extent of HIV binding to GPMVs was quantified as the number of mKO-Gag–labeled virions on DiO-labeled GPMVs (n ≥ 25). Inset shows representative images of virions (green) bound to GPMVs (red) from CD4+/CCR5+ (top), MβCD-treated CD4+/CCR5+ (middle), and plain (bottom) GPMVs. (D) Effect of cholesterol depletion on lipid mixing of HIV with GPMVs isolated from CD4+/CCR5+ (black), cholesterol-depleted (red), and plain (green) HeLa cells. Scale bars, 10 μm. Data are means ± SEM (n = 3).
Fig. 4
Fig. 4. Effect of lysosphingolipids and lysophospholipids on domain size and shape in GPMVs and their fusion with HIV Env particles.
(A) Influence of lysoPC and lysoSM on lipid phases of CD4+/CCR5+ GPMVs stained with DiI. Images were taken after treatment with lysoPC (20 μM) or lysoSM (5 μM) for 30 min at room temperature. The process is shown in movie S7. (B) Effect of lysoPC and lysoSM on binding and lipid mixing between HIV and GPMVs. The extent of HIV binding to GPMVs (n ≥ 25) was quantified as the number of HIV Env particles labeled with mKO-Gag on GPMVs at 4°C for 60 min after treatment with lysoSM or lysoPC. (C) Influence of PLA2 or SCDase treatment on lipid phases of GPMVs. Images were taken after treatment with PLA2 (10 U) or SCDase (10 mU) for 30 min at room temperature. Note that lysophospholipids and lysosphingolipids can be generated by PLA2 and SCDase, respectively. (D) Effect of PLA2 and SCDase on binding and lipid mixing between HIV and GPMVs. (E) Influence of lysolipids on lipid phases of GUVs. LysoPC (20 μM) or lysoSM (5 μM) was added to GUVs composed of brain SM (bSM)/brain PC (bPC)/brain phosphatidylserine (bPS)/cholesterol (2:1:1:1). The process is shown in movie S8. (F) Effect of lysolipids on the extent of liposome fusion mediated by the HIV fusion peptide. Liposomes composed of bSM/bPC/bPS/cholesterol (2:1:1:1) and fusion peptide were added to liposomes preincubated with varying concentrations of lysolipids for 1 hour at room temperature. Scale bars, 10 μm. Data are means ± SEM (n = 3).
Fig. 5
Fig. 5. Binding and fusion of HIV Env particles to SPPMs.
(A) Schematic diagram illustrating the formation of SPPM with ordered and disordered lipid domains (left) and TIRF microscopy setup to visualize the interaction of HIV with SPPM (right). (B) Lateral distribution of CD4 and CCR5 in SPPM. Ld and Lo domains are visualized in SPPM by labeling the membranes with DiI and cholera toxin B (CTxB), respectively. SPPM colabeled with anti-CD4 (Alexa Fluor 488) and anti-CCR5 (Alexa Fluor 647) antibodies. (C) Binding of HIV Env and VSV-G particles to SPPM. SPPM labeled with DiO (left) and bound HIV Env or VSV-G particles labeled with mKO-Gag (center) were visualized by epifluorescence and TIRF microscopy, respectively. Images of membrane-bound pseudoviruses were taken after 60 min of incubation at room temperature. The overlay image (right) shows the preferential binding of HIV but not VSV-G particles to the domain boundaries. (D) Distribution of membrane-bound HIV Env and VSV-G particles on SPPM. Membrane-bound particles were analyzed for their distribution between three membrane regions (Ld, Lo, and a 0.75-μm-wide boundary region) of SPPM. Data are means ± SD (n = 3). (E) CD4- and CCR5-dependent HIV binding. SPPMs were prepared with GPMVs isolated from CD4+/CCR5+ HeLa cells before and after treatment with MβCD and plain CD4/CCR5 HeLa cells. Time courses of mean fluorescence intensities were recorded by TIRF microscopy measuring the binding of HIV Env particles to SPPM. Data are means ± SD (n = 3). a.u., arbitrary units. (F) Fusion of HIV Env particles at Lo/Ld boundaries in an SPPM. The fusion assays were performed at room temperature (~22°C). Lipid phase separation in the SPPM was visualized by labeling with DiI, and fusion events of individual HIV Env particles labeled with lipid dye 1,1′-dioctadecyl-3,3,3′,3′-tetramethylindodicarbocyanine perchlorate (DiD) were monitored by TIRF microscopy. HIV particles (green) fused with SPPM (red), causing round domains to show up because of DiD diffusion within the Lo phase. See also movie S9. (G) Three characteristic types of events of single HIV Env particles on SPPMs. Representative fluorescence traces of single HIV Env particles including docking (constant fluorescence after initial binding), hemifusion (fluorescence decay to approximately half of the original), and full fusion (fluorescence decay to approximately baseline). The inset shows TIRF microscopy images of single particles after given times (in seconds) for each type of behavior. Time zero is defined as the first frame with a visible particle. (H) Relative frequencies of single HIV fusion events in different regions of the SPPM. A total of 211 particles (31 on Ld, 128 on boundary, and 52 on Lo) were analyzed for their fusion events. Data are means ± SD (n = 3). Scale bars, 10 μm.
Fig. 6
Fig. 6. HIV enters cells at the boundaries of ordered lipid domains.
(A) Schematic diagram showing the sequential interaction of HIV gp120/gp41 with the CD4 receptor and CCR5 co-receptor and fusion peptide insertion at phase boundaries in heterogeneous cell membranes with ordered and disordered lipid domains. (B) Effect of cholesterol-rich lipid domains and their size on HIV membrane fusion. The recognition of HIV at domain boundaries leads to membrane fusion at these sites, where increased domain size with increased line tension lowers the energy barrier for fusion. (C) Coalescence and decomposition of dynamic lipid domains. Ordered lipid domains (red) in the plasma membranes of T cells are clustered by pathogen infection, whereas large domains are decomposed by lysosphingolipids. (D) Speculative model for HIV infection including the activation of CD4+ T cells and immune responses to invading pathogens. CD4+ T cells use ordered lipid domains for signal transduction against invading pathogens, whereas HIV uses the domains for entry into the cells. General immune responses after infection of pathogens are indicated by black arrows. Ordered membrane domains in resting T cell plasma membranes are nanoscopic and short-lived, but small dynamic domains can coalesce to create larger ones to function as signaling platforms upon pathogen invasion. Helper CD4+ T cells recognize the pathogen-derived antigens on the surface of antigen-presenting cells (APC) and become activated by coalescence of membrane domains. The activation of CD4+ T cells stimulates the ability of B cells and CD8+ T cells to defend against the invading pathogens. In this model, we propose that CD4+ T cells that are challenged by pathogens are more prone to HIV infection than resting T cells, as indicated by the red arrows. The HIV infection leads to apoptotic T cell death and ultimately results in the progression to AIDS.

Similar articles

Cited by

References

    1. Simons K., Ikonen E., Functional rafts in cell membranes. Nature 387, 569–572 (1997). - PubMed
    1. van Meer G., Voelker D. R., Feigenson G. W., Membrane lipids: Where they are and how they behave. Nat. Rev. Mol. Cell Biol. 9, 112–124 (2008). - PMC - PubMed
    1. Lingwood D., Kaiser H.-J., Levental I., Simons K., Lipid rafts as functional heterogeneity in cell membranes. Biochem. Soc. Trans. 37, 955–960 (2009). - PubMed
    1. Brown D. A., London E., Functions of lipid rafts in biological membranes. Annu. Rev. Cell Dev. Biol. 14, 111–136 (1998). - PubMed
    1. Anderson R. G. W., Jacobson K., A role for lipid shells in targeting proteins to caveolae, rafts, and other lipid domains. Science 296, 1821–1825 (2002). - PubMed

Publication types