Development of Aggressive Pancreatic Ductal Adenocarcinomas Depends on Granulocyte Colony Stimulating Factor Secretion in Carcinoma Cells
- PMID: 28775207
- PMCID: PMC5581681
- DOI: 10.1158/2326-6066.CIR-16-0311
Development of Aggressive Pancreatic Ductal Adenocarcinomas Depends on Granulocyte Colony Stimulating Factor Secretion in Carcinoma Cells
Abstract
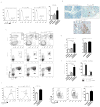
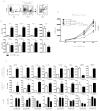
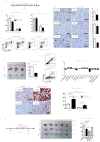
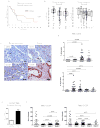
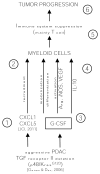
The survival rate for pancreatic ductal adenocarcinoma (PDAC) remains low. More therapeutic options to treat this disease are needed, for the current standard of care is ineffective. Using an animal model of aggressive PDAC (Kras/p48TGFβRIIKO), we discovered an effect of TGFβ signaling in regulation of G-CSF secretion in pancreatic epithelium. Elevated concentrations of G-CSF in PDAC promoted differentiation of Ly6G+ cells from progenitors, stimulated IL10 secretion from myeloid cells, and decreased T-cell proliferation via upregulation of Arg, iNOS, VEGF, IL6, and IL1b from CD11b+ cells. Deletion of csf3 in PDAC cells or use of a G-CSF-blocking antibody decreased tumor growth. Anti-G-CSF treatment in combination with the DNA synthesis inhibitor gemcitabine reduced tumor size, increased the number of infiltrating T cells, and decreased the number of Ly6G+ cells more effectively than gemcitabine alone. Human analysis of human datasets from The Cancer Genome Atlas and tissue microarrays correlated with observations from our mouse model experiments, especially in patients with grade 1, stage II disease. We propose that in aggressive PDAC, elevated G-CSF contributes to tumor progression through promoting increases in infiltration of neutrophil-like cells with high immunosuppressive activity. Such a mechanism provides an avenue for a neoadjuvant therapeutic approach for this devastating disease. Cancer Immunol Res; 5(9); 718-29. ©2017 AACR.
©2017 American Association for Cancer Research.
Conflict of interest statement
The authors whose names are listed above have
Figures
Similar articles
-
Significant association of miRNA 34a with BRCA1 expression in pancreatic ductal adenocarcinoma: an insight on miRNA regulatory pathways in the Pakistani population.BMC Cancer. 2024 Dec 18;24(1):1543. doi: 10.1186/s12885-024-13259-6. BMC Cancer. 2024. PMID: 39696052 Free PMC article.
-
Antibody-based delivery of interleukin-2 modulates the immunosuppressive tumor microenvironment and achieves cure in pancreatic ductal adenocarcinoma syngeneic mice.J Exp Clin Cancer Res. 2025 Jan 7;44(1):7. doi: 10.1186/s13046-024-03238-x. J Exp Clin Cancer Res. 2025. PMID: 39773310 Free PMC article.
-
Molecular Pathway and Immune Profile Analysis of IPMN-Derived Versus PanIN-Derived Pancreatic Ductal Adenocarcinomas.Int J Mol Sci. 2024 Dec 7;25(23):13164. doi: 10.3390/ijms252313164. Int J Mol Sci. 2024. PMID: 39684873 Free PMC article.
-
Impact of residual disease as a prognostic factor for survival in women with advanced epithelial ovarian cancer after primary surgery.Cochrane Database Syst Rev. 2022 Sep 26;9(9):CD015048. doi: 10.1002/14651858.CD015048.pub2. Cochrane Database Syst Rev. 2022. PMID: 36161421 Free PMC article. Review.
-
Interventions to reduce harm from continued tobacco use.Cochrane Database Syst Rev. 2016 Oct 13;10(10):CD005231. doi: 10.1002/14651858.CD005231.pub3. Cochrane Database Syst Rev. 2016. PMID: 27734465 Free PMC article. Review.
Cited by
-
The reciprocal regulation between host tissue and immune cells in pancreatic ductal adenocarcinoma: new insights and therapeutic implications.Mol Cancer. 2019 Dec 13;18(1):184. doi: 10.1186/s12943-019-1117-9. Mol Cancer. 2019. PMID: 31831007 Free PMC article. Review.
-
A NOTCH1 Mutation Found in a Newly Established Ovarian Cancer Cell Line (FDOVL) Promotes Lymph Node Metastasis in Ovarian Cancer.Int J Mol Sci. 2023 Mar 7;24(6):5091. doi: 10.3390/ijms24065091. Int J Mol Sci. 2023. PMID: 36982170 Free PMC article.
-
Diamonds in the Rough: Harnessing Tumor-Associated Myeloid Cells for Cancer Therapy.Front Immunol. 2018 Oct 8;9:2250. doi: 10.3389/fimmu.2018.02250. eCollection 2018. Front Immunol. 2018. PMID: 30349530 Free PMC article. Review.
-
Tumoral EHF predicts the efficacy of anti-PD1 therapy in pancreatic ductal adenocarcinoma.J Exp Med. 2019 Mar 4;216(3):656-673. doi: 10.1084/jem.20180749. Epub 2019 Feb 7. J Exp Med. 2019. PMID: 30733283 Free PMC article.
-
IL-17A-producing CD8+ T cells promote PDAC via induction of inflammatory cancer-associated fibroblasts.Gut. 2023 Aug;72(8):1510-1522. doi: 10.1136/gutjnl-2022-327855. Epub 2023 Feb 9. Gut. 2023. PMID: 36759154 Free PMC article.
References
-
- Nagathihalli NS, Castellanos JA, Shi C, Beesetty Y, Reyzer ML, Caprioli R, et al. Signal Transducer and Activator of Transcription 3, Mediated Remodeling of the Tumor Microenvironment Results in Enhanced Tumor Drug Delivery in a Mouse Model of Pancreatic Cancer. Gastroenterology. 2015;149(7):1932–43 e9. - PMC - PubMed
MeSH terms
Substances
Grants and funding
LinkOut - more resources
Full Text Sources
Other Literature Sources
Research Materials
Miscellaneous

